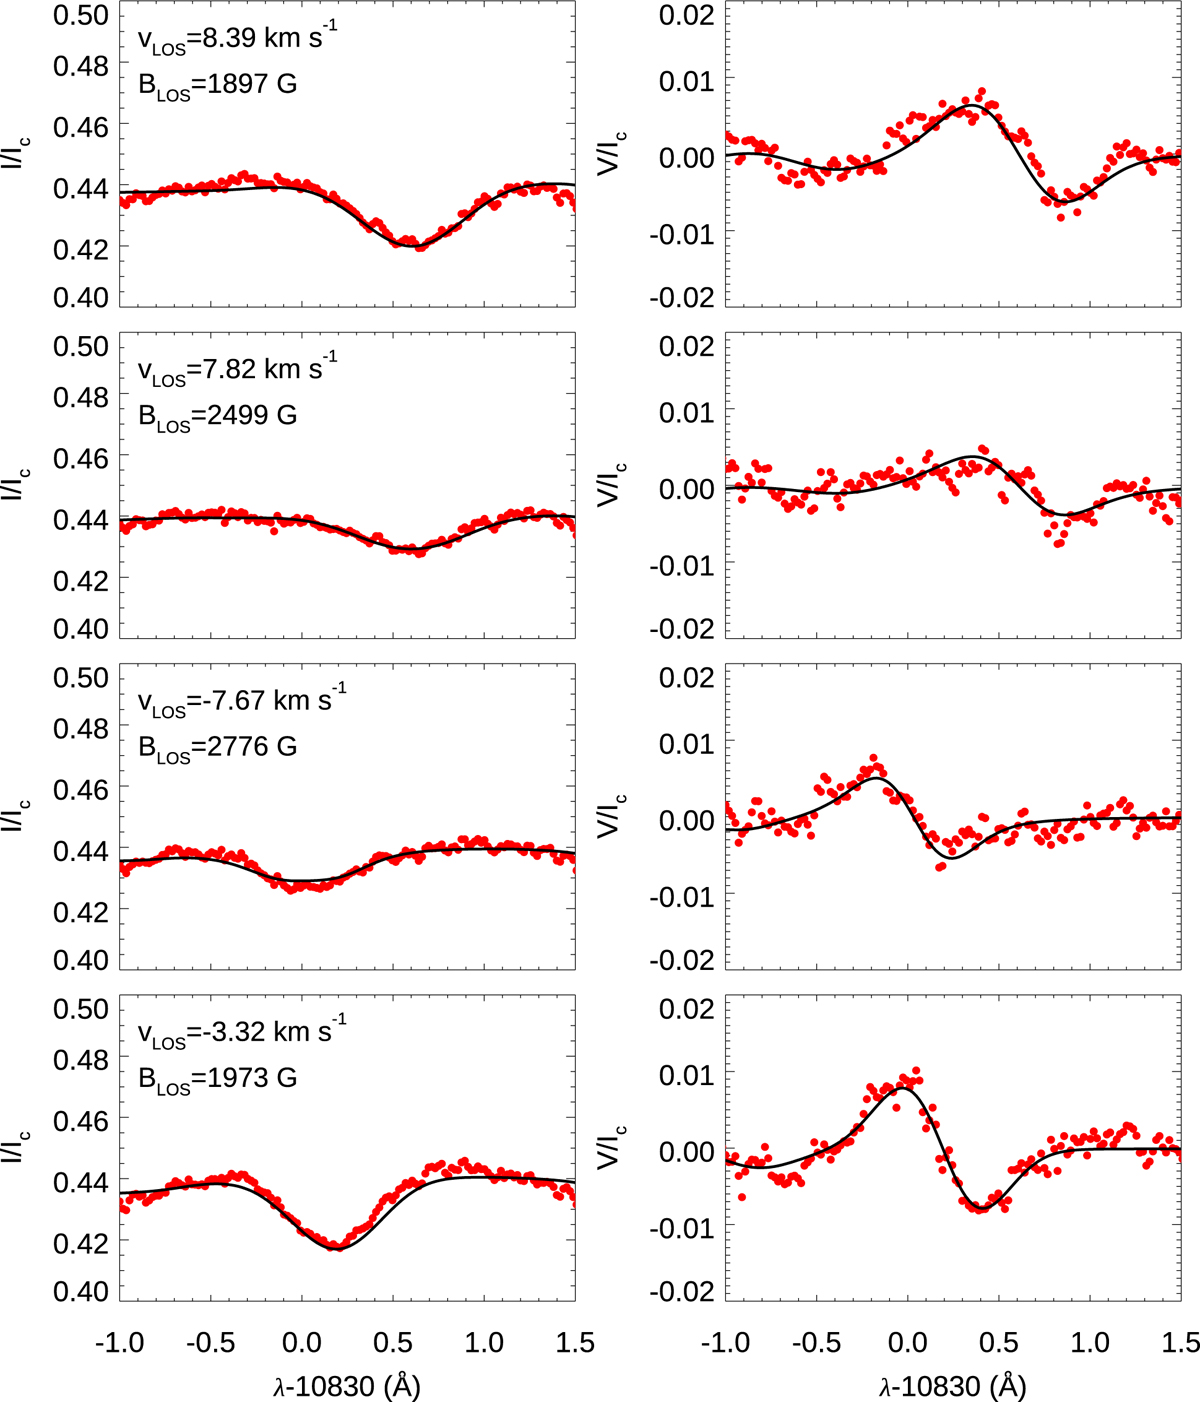
Fig. 6.
Download original image
Observed (red dots) and inverted (black lines) Stokes I (left panels) and V (right panels) profiles of the He I 10 830 Å line during the development of a large amplitude magnetic field fluctuation. Each row corresponds to a different time step (indicated by vertical dotted lines in Fig. 4), with time increasing from top to bottom.
Current usage metrics show cumulative count of Article Views (full-text article views including HTML views, PDF and ePub downloads, according to the available data) and Abstracts Views on Vision4Press platform.
Data correspond to usage on the plateform after 2015. The current usage metrics is available 48-96 hours after online publication and is updated daily on week days.
Initial download of the metrics may take a while.