Open Access
Fig. 3.
Download original image
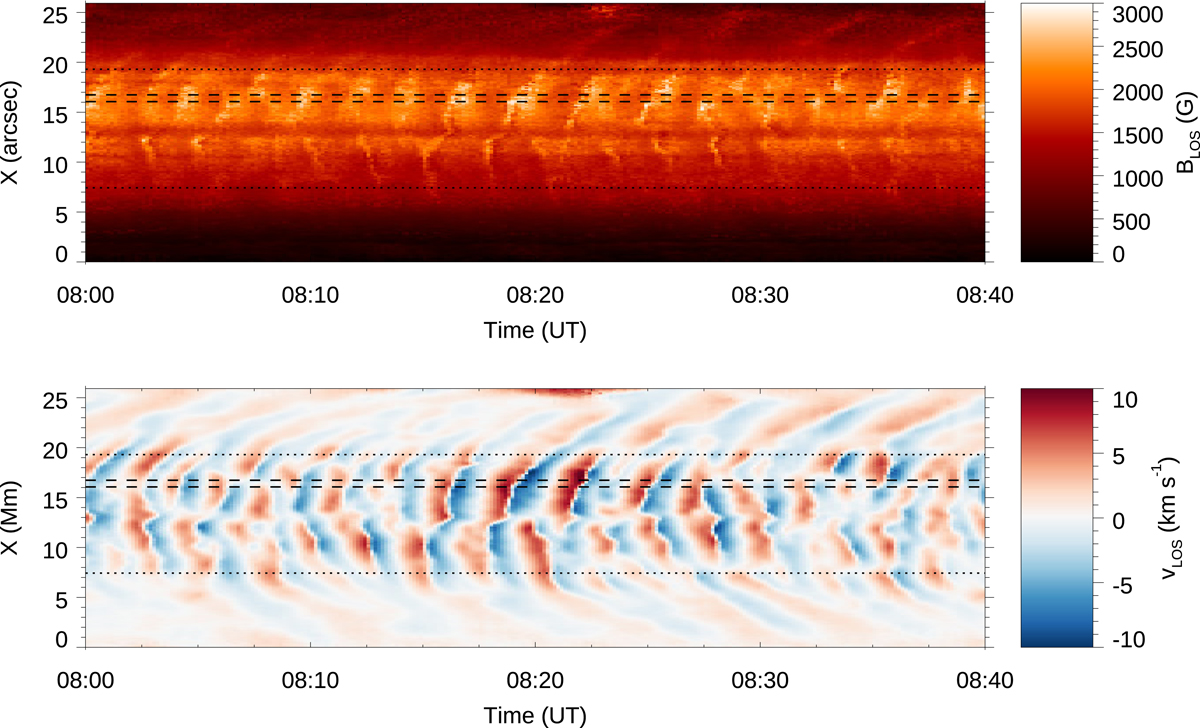
Temporal evolution of the chromospheric magnetic field (top panel) and LOS velocity (bottom panel) along the spectrograph slit, as inferred from the inversions of He I triplet. Horizontal dotted lines indicate the umbra-penumbra boundaries. Horizontal dashed lines mark the spatial locations illustrated in Figs. 4 and 5.
Current usage metrics show cumulative count of Article Views (full-text article views including HTML views, PDF and ePub downloads, according to the available data) and Abstracts Views on Vision4Press platform.
Data correspond to usage on the plateform after 2015. The current usage metrics is available 48-96 hours after online publication and is updated daily on week days.
Initial download of the metrics may take a while.