Fig. 14.
Download original image
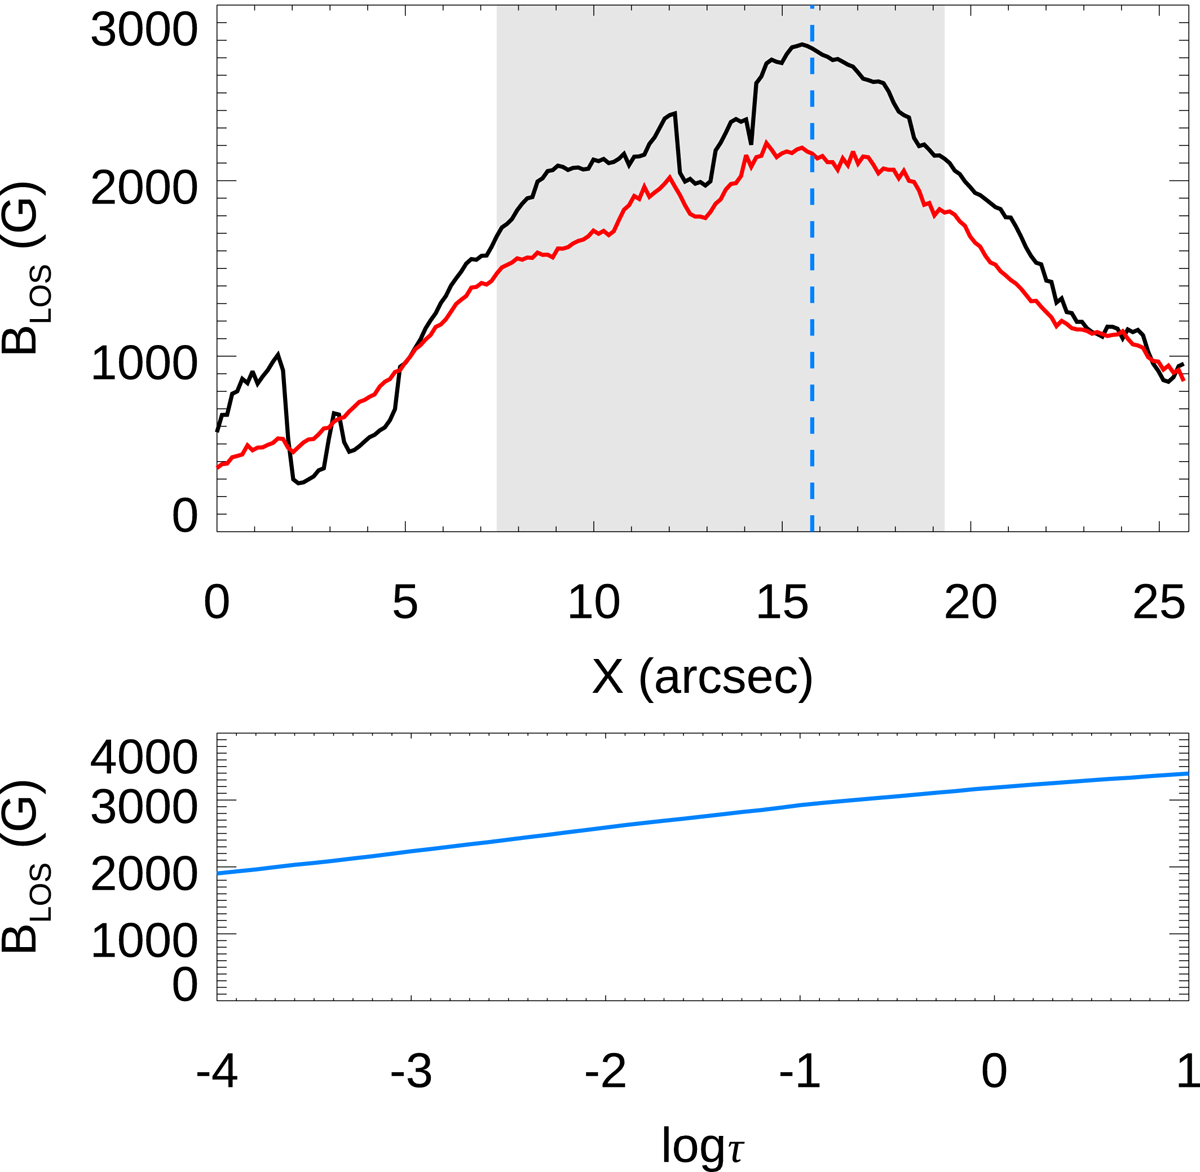
Median of the inferred LOS magnetic field. Top panel: variation in the LOS magnetic field with the position along the slit at log τ = −1.5 (black line, derived from inversions of the Si I 10 827 Å line) and at the chromosphere (red line, derived from He I 10 830 Å inversions). The gray shaded area indicates the umbra region. The vertical dashed line corresponds to the location plotted in the bottom panel. Bottom panel: vertical stratification of the median photospheric magnetic field inferred with the Si I 10 827 Å line at a selected umbral location.
Current usage metrics show cumulative count of Article Views (full-text article views including HTML views, PDF and ePub downloads, according to the available data) and Abstracts Views on Vision4Press platform.
Data correspond to usage on the plateform after 2015. The current usage metrics is available 48-96 hours after online publication and is updated daily on week days.
Initial download of the metrics may take a while.