Fig. 13.
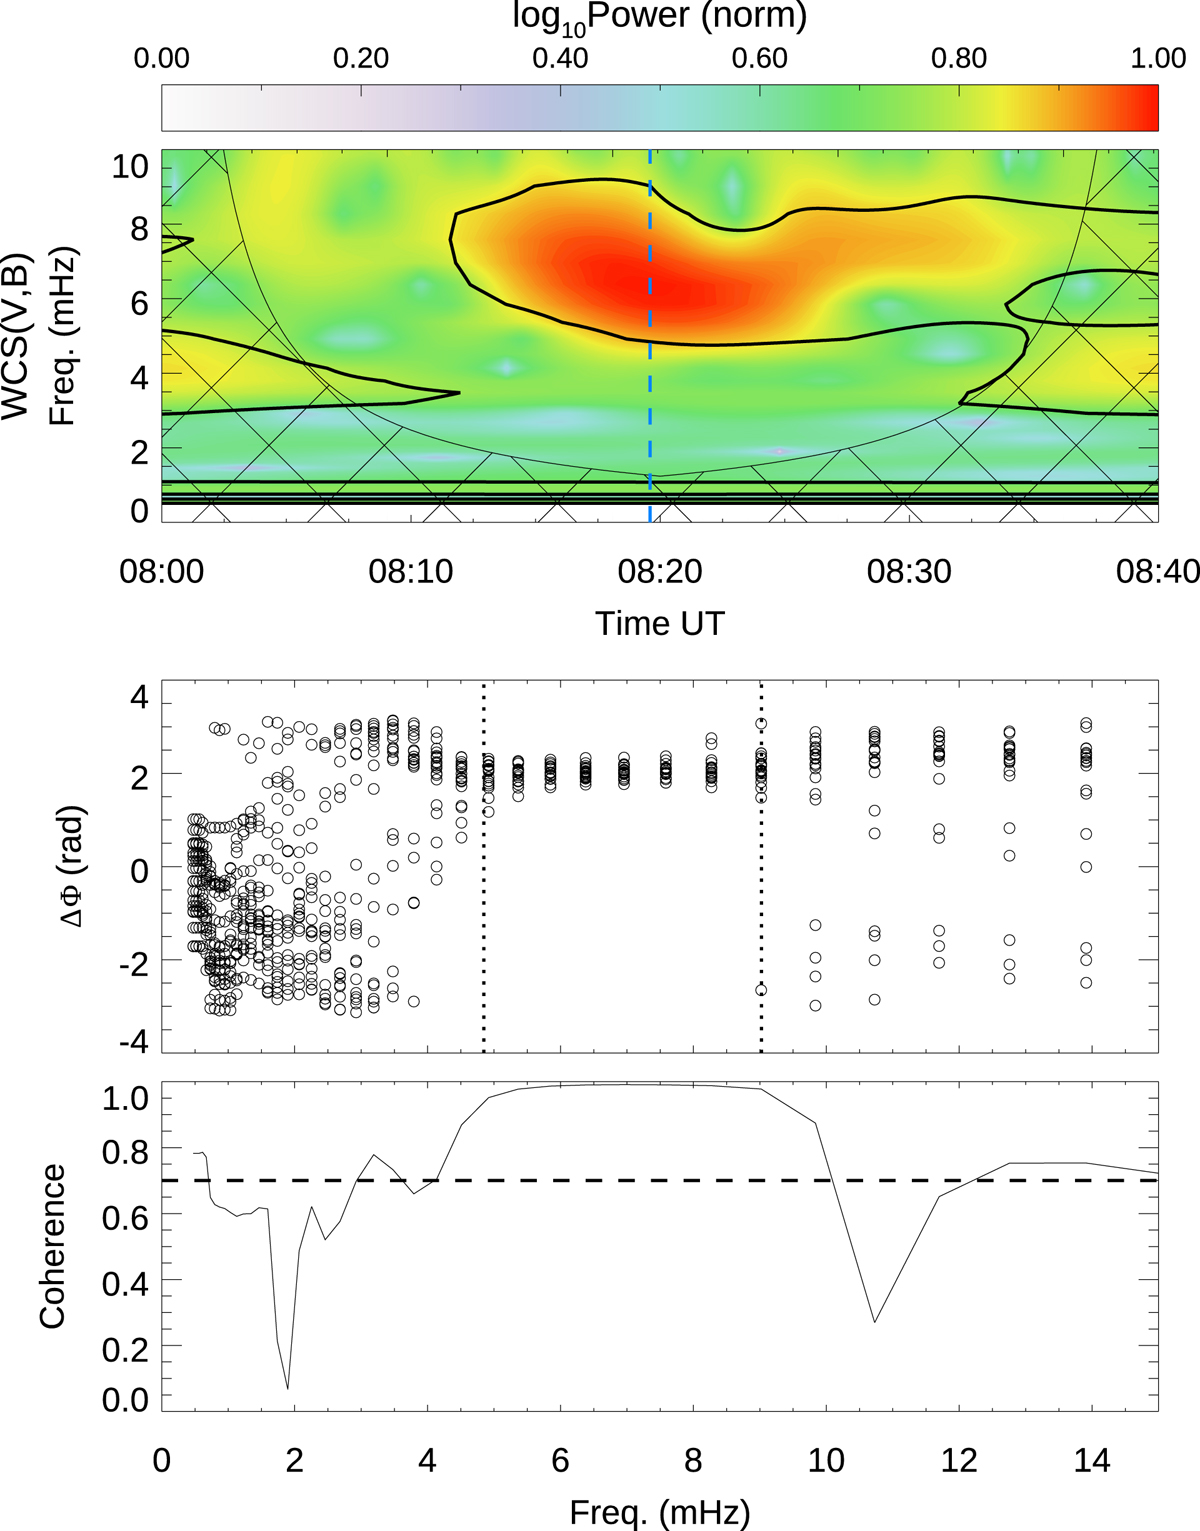
Download original image
Wavelet analysis of velocity and magnetic field fluctuations measured with the He I 10 830 Å triplet. Top panel: power of the WCS between the velocity and magnetic field fluctuations. The gridded region indicates the parts of the spectra outside the cone of influence. Solid black lines mark the 95% confidence level. The vertical dashed blue line indicates the time illustrated in the spectra from the middle and bottom panels. Middle panel: wavelet phase difference between the velocity and magnetic field fluctuations in the umbra at 08:20 UT. Vertical dotted lines delimit the region where the power of the WCS is above the 95% confidence level. Bottom panel: coherence of the phase difference. The horizontal dashed lines indicate the 0.7 threshold.
Current usage metrics show cumulative count of Article Views (full-text article views including HTML views, PDF and ePub downloads, according to the available data) and Abstracts Views on Vision4Press platform.
Data correspond to usage on the plateform after 2015. The current usage metrics is available 48-96 hours after online publication and is updated daily on week days.
Initial download of the metrics may take a while.