Fig. 11.
Download original image
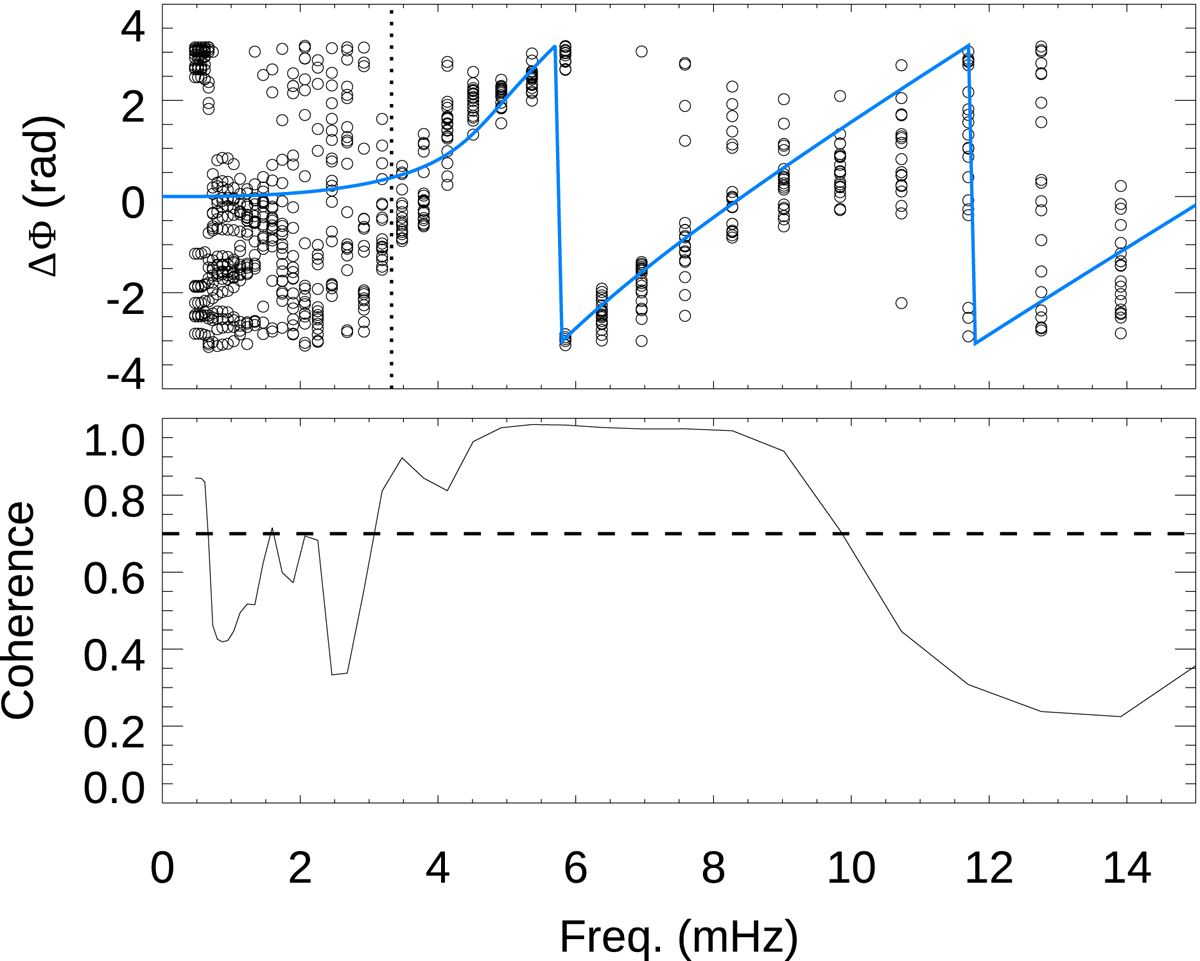
Wavelet phase difference between the photospheric and chromospheric umbral velocities around 08:13 UT. Top panel: phase difference at every location in the selected region. The power of the WCS of frequencies higher than that indicated by the vertical dotted line is above the 95% confidence level. The blue line represents the expected phase difference for linear wave propagation in a gravitationally stratified atmosphere with radiative losses (T0 = 4160 K, Δz = 900 km, τR = 20). Bottom panel: coherence of the phase difference. The phase differences where the confidence is below 95% (frequencies below the vertical dotted line in the top panel) and with coherence below the threshold (horizontal dashed line in the bottom panel) are unreliable.
Current usage metrics show cumulative count of Article Views (full-text article views including HTML views, PDF and ePub downloads, according to the available data) and Abstracts Views on Vision4Press platform.
Data correspond to usage on the plateform after 2015. The current usage metrics is available 48-96 hours after online publication and is updated daily on week days.
Initial download of the metrics may take a while.