Fig. 10.
Download original image
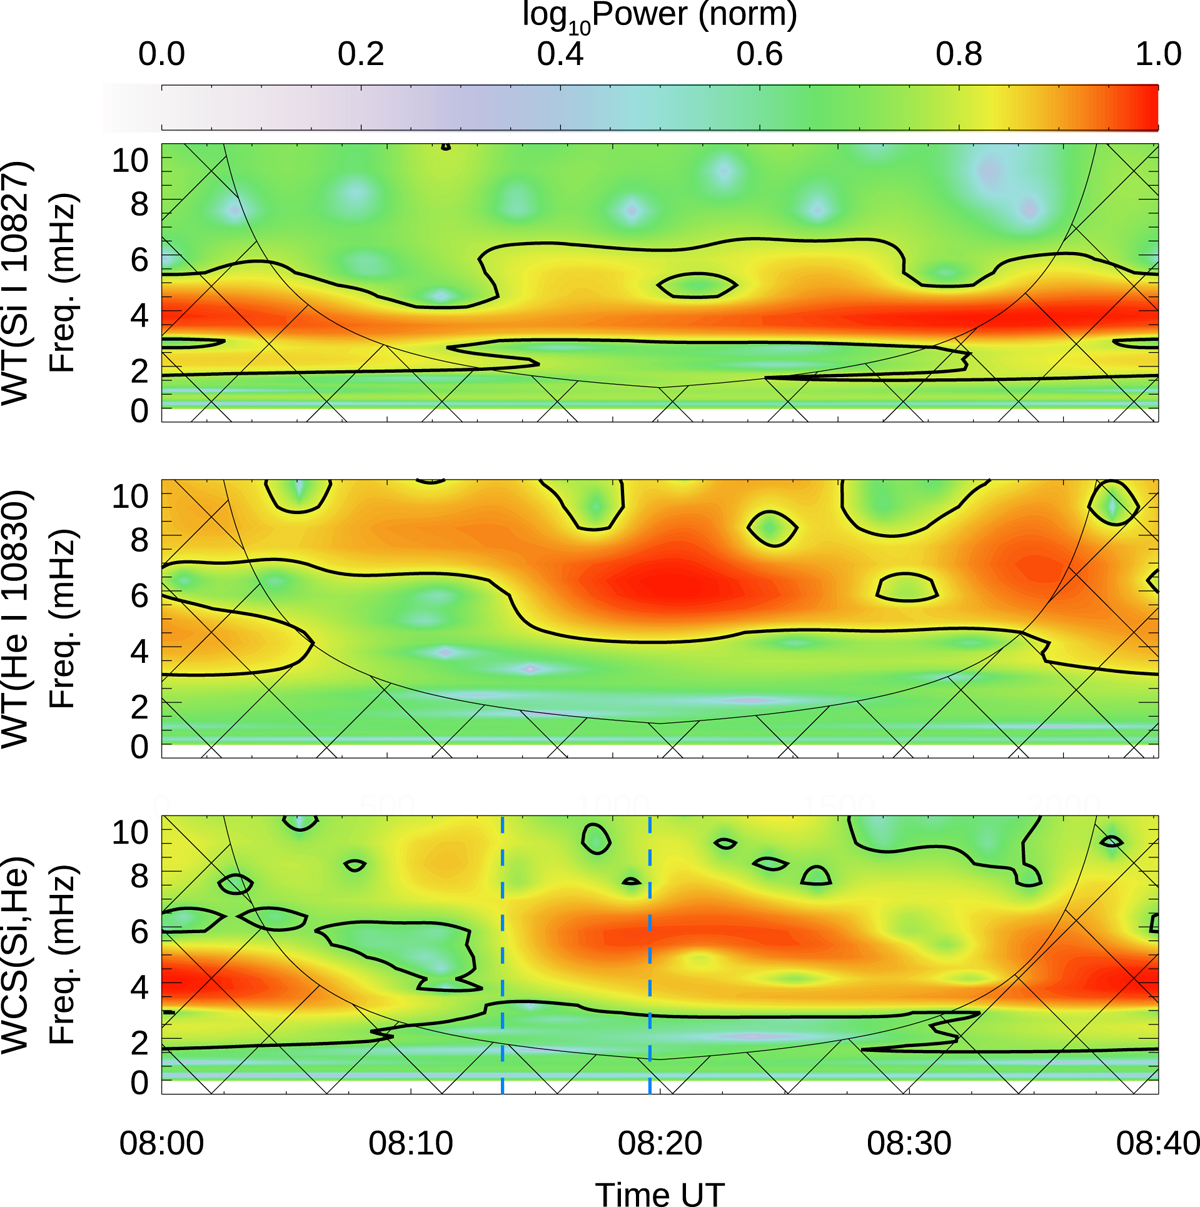
Wavelet power of the velocity at a randomly chosen umbral location. Top panel: wavelet power of the photospheric velocity derived from the Si I 10 827 Å line. Middle panel: wavelet power of the chromospheric velocity derived from the He I 10 830 Å line. bottom panel: power of the WCS between the photospheric and chromospheric velocities. The gridded region indicates the parts of the spectra outside the cone of influence. Solid black lines mark the 95% confidence level. The vertical dashed blue lines in the bottom panel indicate the times illustrated in Figs. 11 and 12.
Current usage metrics show cumulative count of Article Views (full-text article views including HTML views, PDF and ePub downloads, according to the available data) and Abstracts Views on Vision4Press platform.
Data correspond to usage on the plateform after 2015. The current usage metrics is available 48-96 hours after online publication and is updated daily on week days.
Initial download of the metrics may take a while.