Open Access
Fig. 2.
Download original image
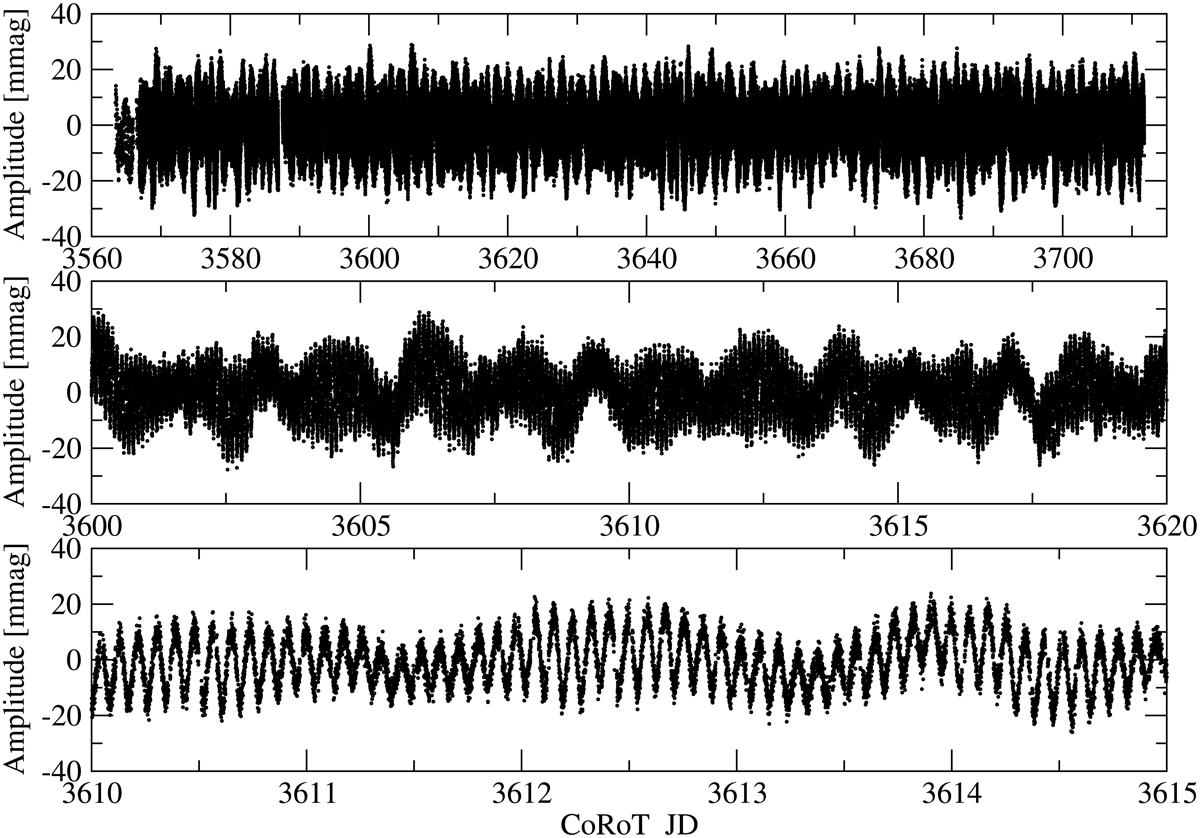
Light curve of the star CoRoT 102314644 corrected for long-term trends and outliers (see main text) for different timescales. From top to bottom, the complete light curve over 148 d, then a set over 20 d, and finally a zoomed-in view of the 5 d subset.
Current usage metrics show cumulative count of Article Views (full-text article views including HTML views, PDF and ePub downloads, according to the available data) and Abstracts Views on Vision4Press platform.
Data correspond to usage on the plateform after 2015. The current usage metrics is available 48-96 hours after online publication and is updated daily on week days.
Initial download of the metrics may take a while.