Fig. 11.
Download original image
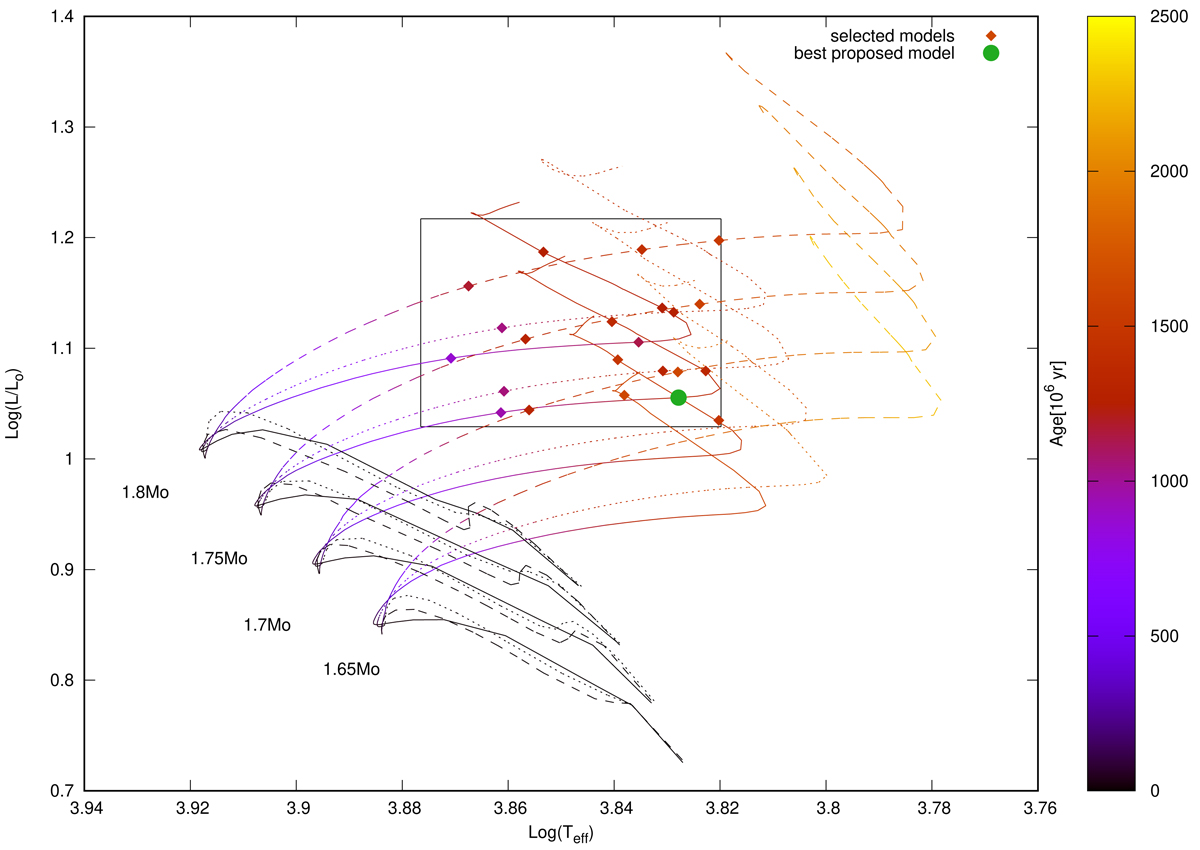
HR diagram showing evolutionary sequences for different stellar masses. Sequences shown in solid lines correspond to cases without overshooting, while those in short-dashed lines have αov = 0.1 and long-dashed lines correspond to evolutionary sequences with αov = 0.3. The box indicates the values of log(Teff) and log(L/L⊙) derived in Sect. 2. Colour-coding shows the age of each evolutionary sequence. Selected models listed in Table 8 are shown by diamonds. The green circle shows the position of our best-fit model (see main text).
Current usage metrics show cumulative count of Article Views (full-text article views including HTML views, PDF and ePub downloads, according to the available data) and Abstracts Views on Vision4Press platform.
Data correspond to usage on the plateform after 2015. The current usage metrics is available 48-96 hours after online publication and is updated daily on week days.
Initial download of the metrics may take a while.