Fig. 9.
Download original image
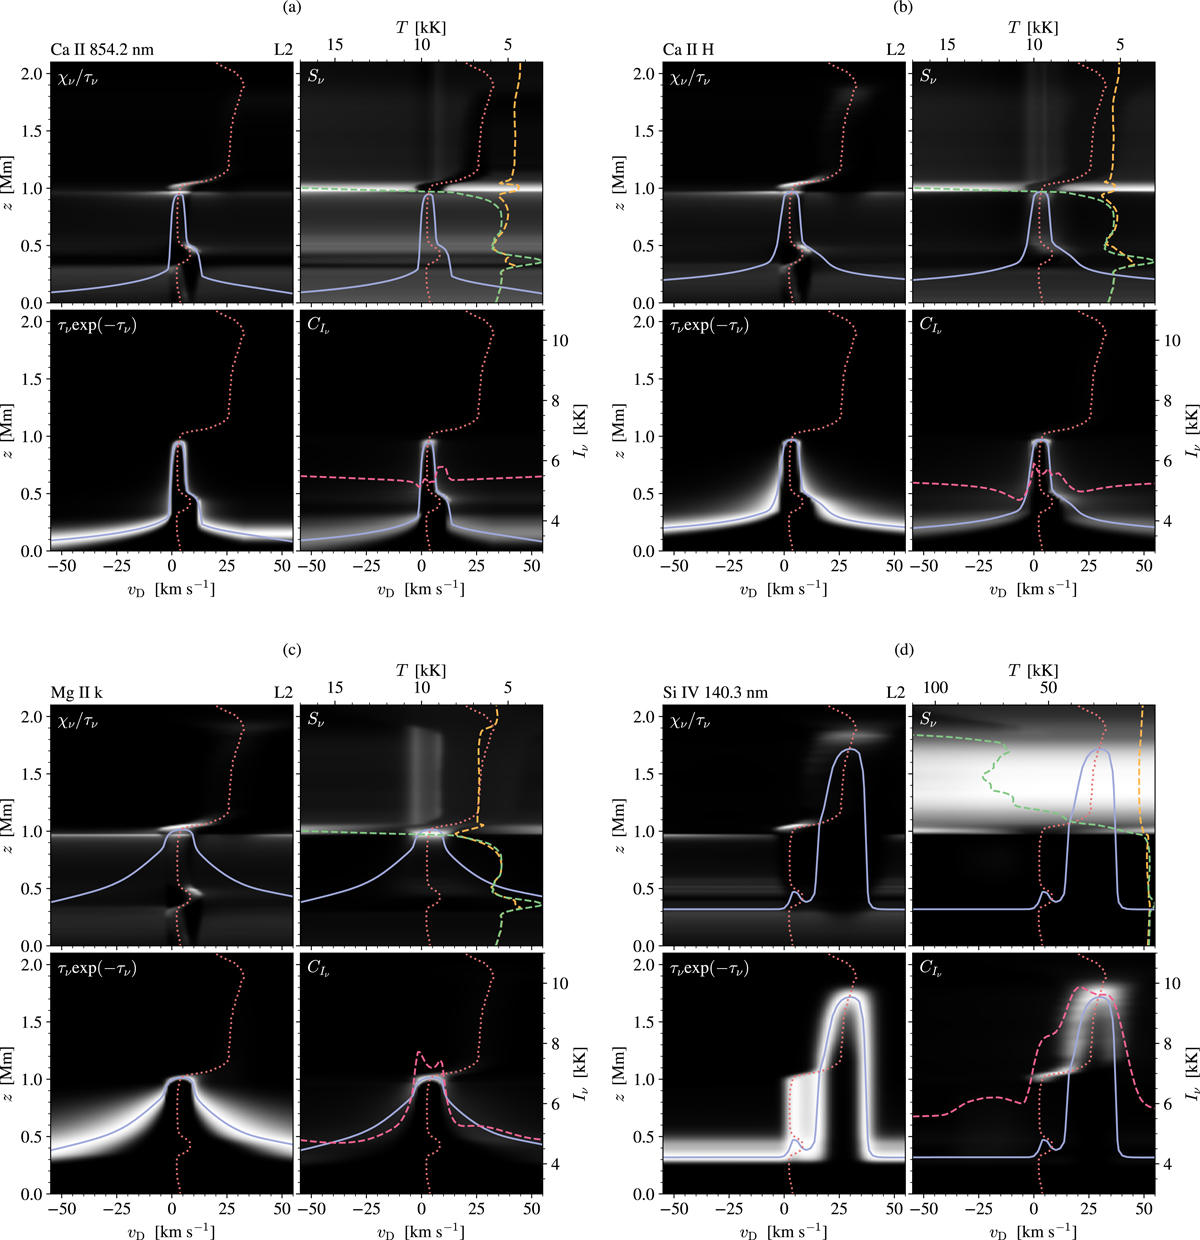
Intensity formation of the Ca II 854.2 nm (a), Ca II H (b), Mg II k (c), and Si IV 140.3 nm (d) spectral lines at the L2 location at t′ = 28 s. Each subfigure consists of four panels, where the quantities given in the top left corners are shown in greyscale as functions of frequency from the line centre (in units of Doppler offset) and atmospheric height. The τν = 1 height (purple solid) and vertical velocity (red dotted) are displayed in all panels. Negative (positive) velocities correspond to upflows (downflows). The top right panels display the source function at vD = 0 (yellow dashed) and Planck function (green dashed) in units of brightness temperature specified along the top (we note that the temperature range in (d) is larger because Si IV is sensitive to much higher temperatures). Multiplication of the first three panels produces the contribution function in the bottom right panel. This panel also contains the intensity profile (pink dashed) in units of brightness temperature. Gamma correction is added to the CIν term to amplify the weaker values.
Current usage metrics show cumulative count of Article Views (full-text article views including HTML views, PDF and ePub downloads, according to the available data) and Abstracts Views on Vision4Press platform.
Data correspond to usage on the plateform after 2015. The current usage metrics is available 48-96 hours after online publication and is updated daily on week days.
Initial download of the metrics may take a while.