Fig. 2.
Download original image
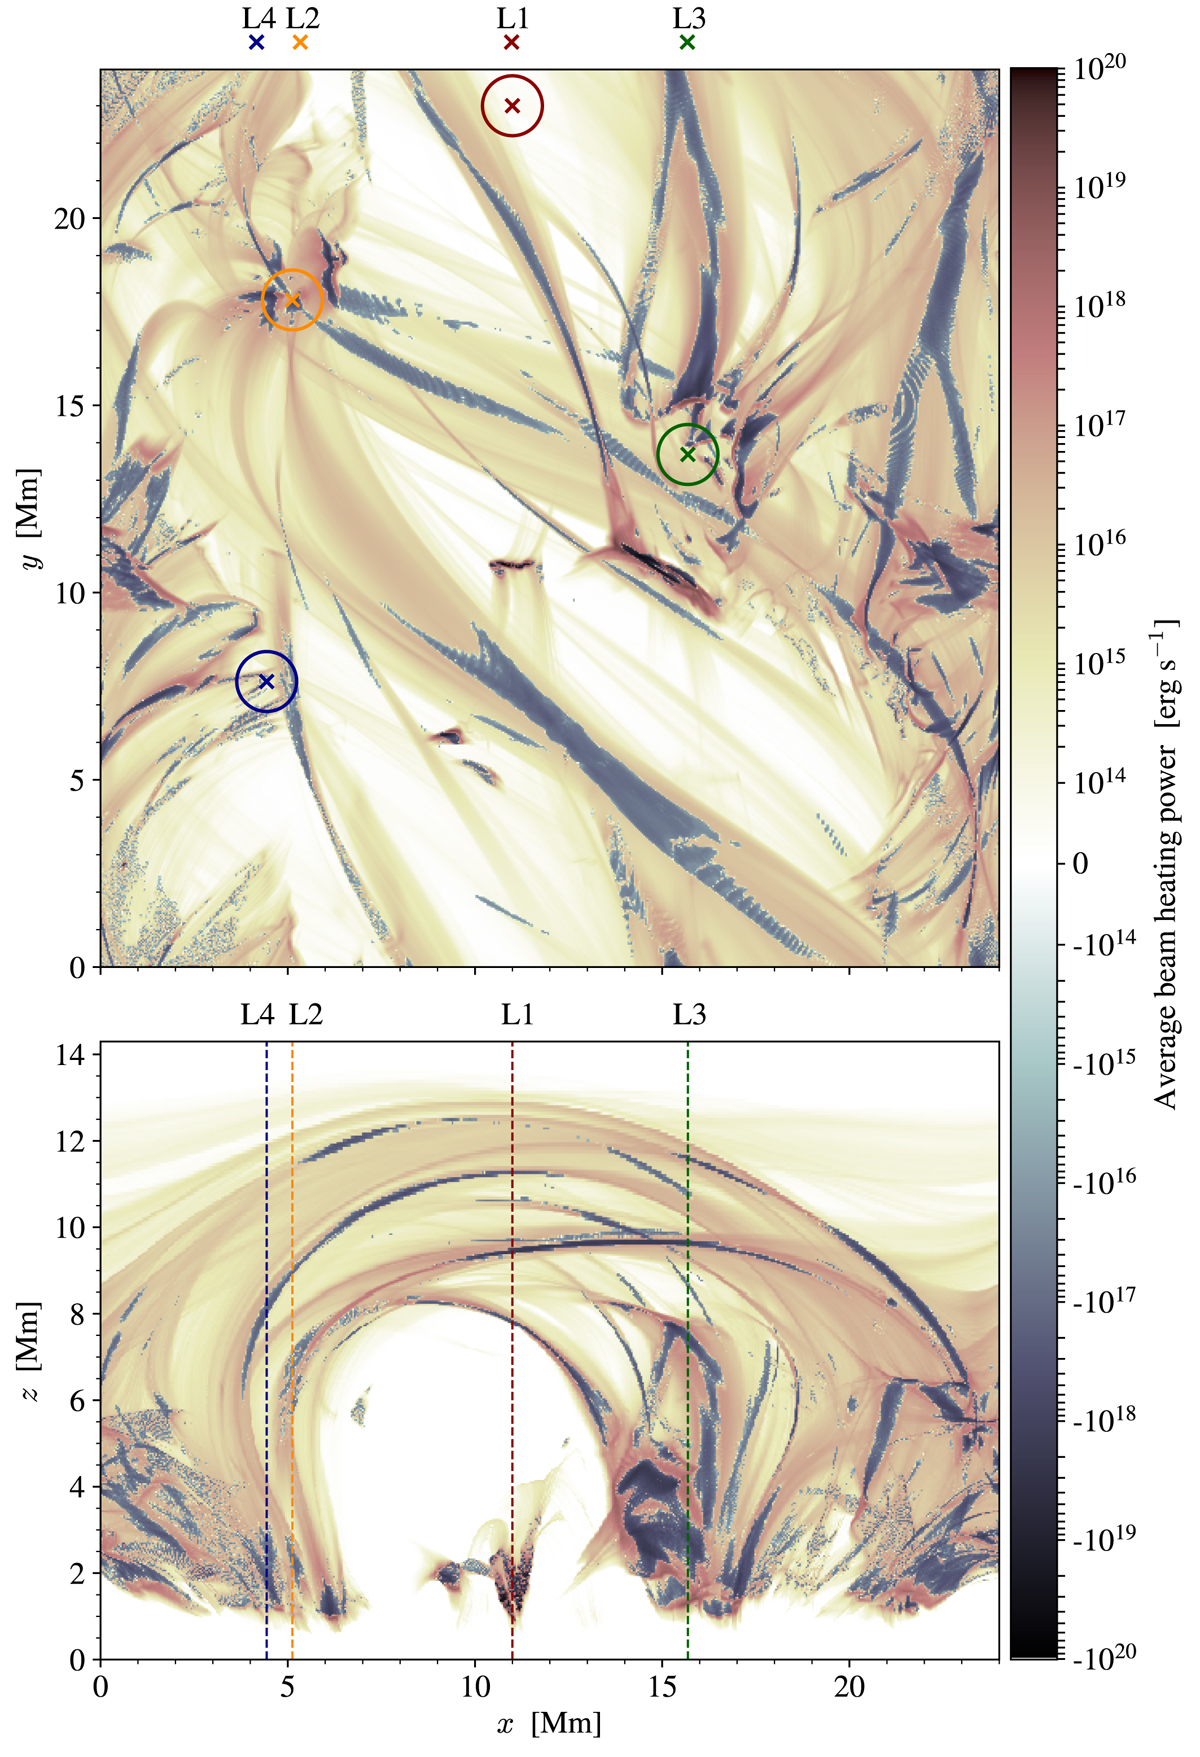
Integrated average beam heating power along the z-axis (upper panel) and y-axis (lower panel) of the Bifrost simulation snapshot at t′ = 28 s. The blue regions represent where a fraction p of the reconnection energy is being injected into the accelerated electrons, while the orange regions show where the non-thermal electrons deposit their energy and heat the plasma. The coloured circles in the upper panel are the areas of interest, while the crosses (upper panel) and dashed lines (lower panel) mark the specific locations analysed in detail (L1, L2, L3, and L4).
Current usage metrics show cumulative count of Article Views (full-text article views including HTML views, PDF and ePub downloads, according to the available data) and Abstracts Views on Vision4Press platform.
Data correspond to usage on the plateform after 2015. The current usage metrics is available 48-96 hours after online publication and is updated daily on week days.
Initial download of the metrics may take a while.