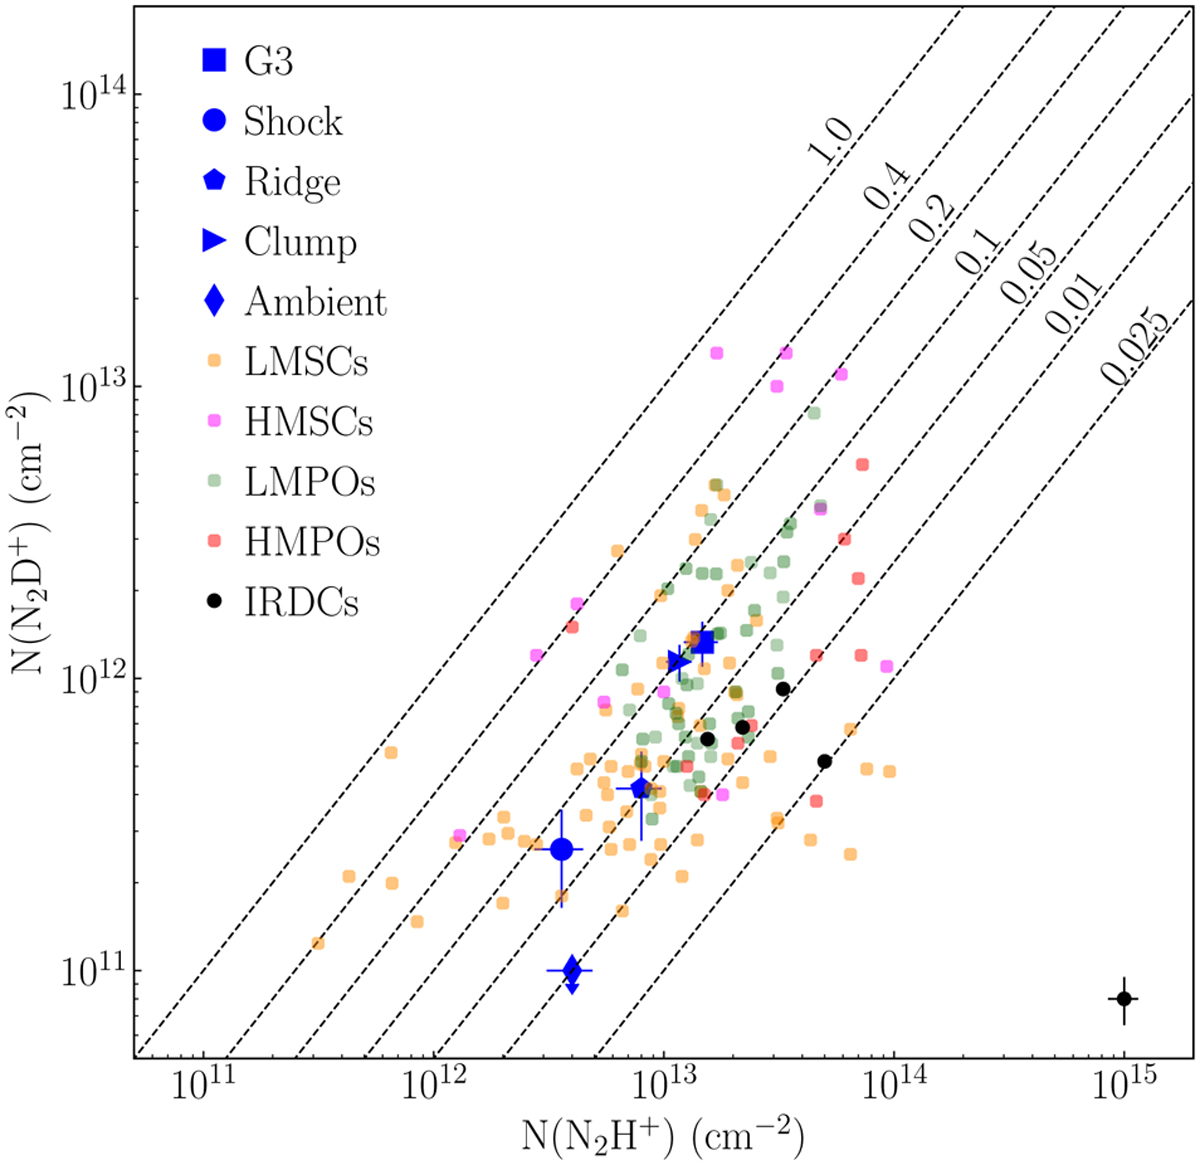
Fig. 3
Download original image
Column density values from the MADCUBA analysis of N2D+ as a function of N2H+ for all the positions analysed in this work, as well as literature values for LMSCs (Crapsi et al. 2005; Fontani et al. 2006; Friesen et al. 2013; Cheng et al. 2021), HMSCs (Fontani et al. 2011; Kong et al. 2016), HMPOs (Fontani et al. 2011), LMPOs (Emprechtinger et al. 2009; Friesen et al. 2013), and IRDCs (Miettinen et al. 2011; Gerner et al. 2015; Barnes et al. 2016). The average uncertainties associated to the data point from the literature are reported in the bottom right corner. Finally, dotted lines correspond to fixed values of D/H ratios.
Current usage metrics show cumulative count of Article Views (full-text article views including HTML views, PDF and ePub downloads, according to the available data) and Abstracts Views on Vision4Press platform.
Data correspond to usage on the plateform after 2015. The current usage metrics is available 48-96 hours after online publication and is updated daily on week days.
Initial download of the metrics may take a while.