Fig. D.1
Download original image
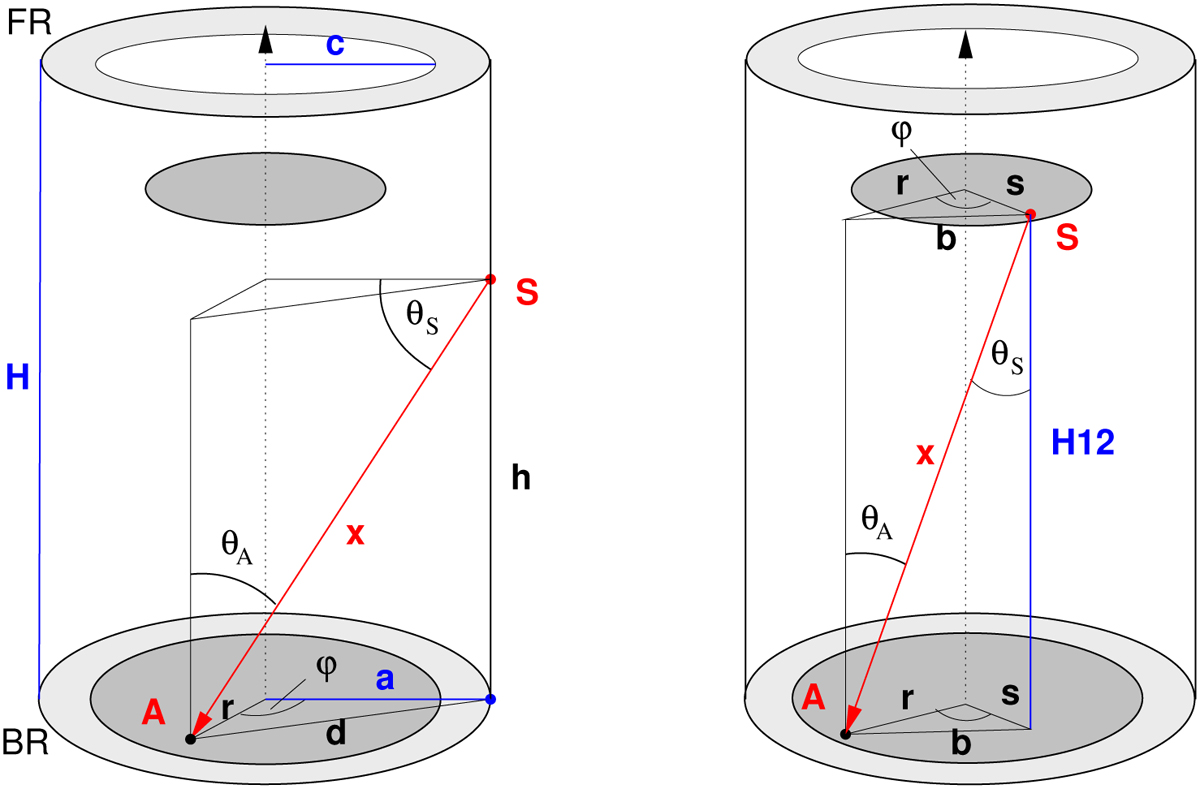
Geometric model of the telescope to compute contamination on the optical surfaces. Left panel: Contamination from a point Q on the baffle wall onto a point P on M1 (bottom grey disk). Right panel: Contamination from a point Q on M2 (top grey disk) onto P. The same setup can be used to compute contamination of M1 by sublimation from the ‘front ring’ (FR), contamination of M2 from M1 and the ‘back ring’ BR, and the water flux loss through the front aperture, simply by adjusting the respective integral bounds. The blue lines indicate fixed parameters listed in Table D.1.
Current usage metrics show cumulative count of Article Views (full-text article views including HTML views, PDF and ePub downloads, according to the available data) and Abstracts Views on Vision4Press platform.
Data correspond to usage on the plateform after 2015. The current usage metrics is available 48-96 hours after online publication and is updated daily on week days.
Initial download of the metrics may take a while.