Open Access
Fig. 12
Download original image
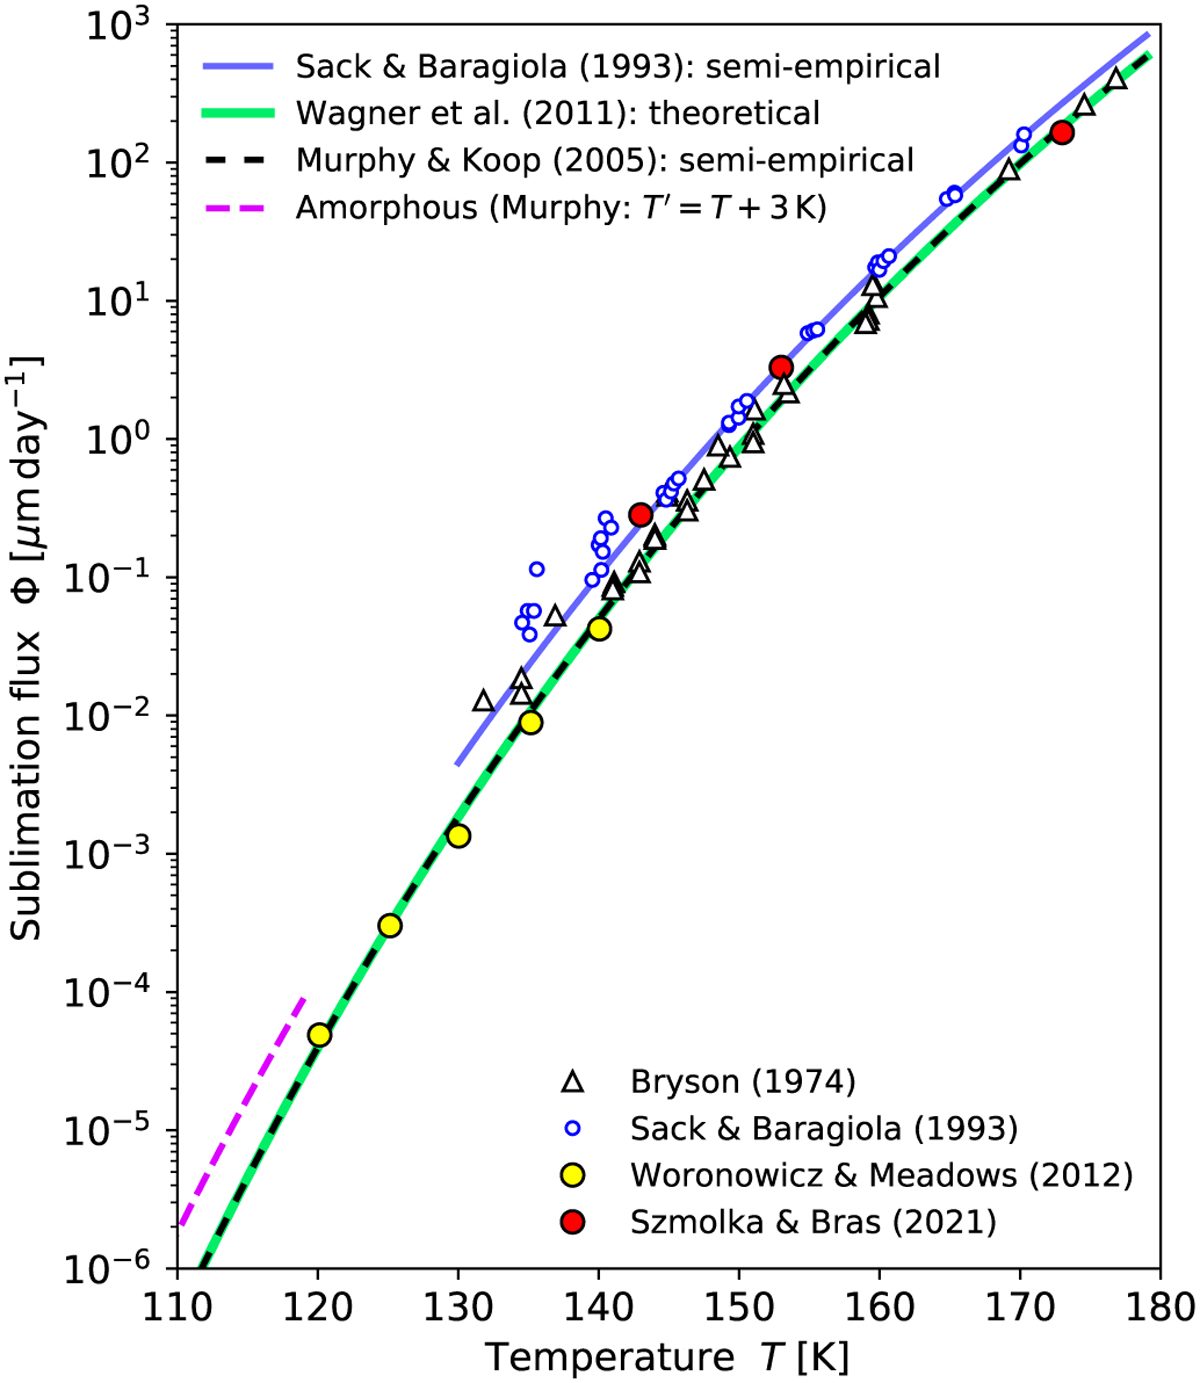
Sublimation-flux models for amorphous and crystalline (hexagonal) ice. Overlaid are various measurements. The model for amorphous ice is shown up to 120 K by the dashed pink line; it is obtained by shifting the Murphy & Koop (2005) curve by 3 K to lower temperatures.
Current usage metrics show cumulative count of Article Views (full-text article views including HTML views, PDF and ePub downloads, according to the available data) and Abstracts Views on Vision4Press platform.
Data correspond to usage on the plateform after 2015. The current usage metrics is available 48-96 hours after online publication and is updated daily on week days.
Initial download of the metrics may take a while.