Fig. 11
Download original image
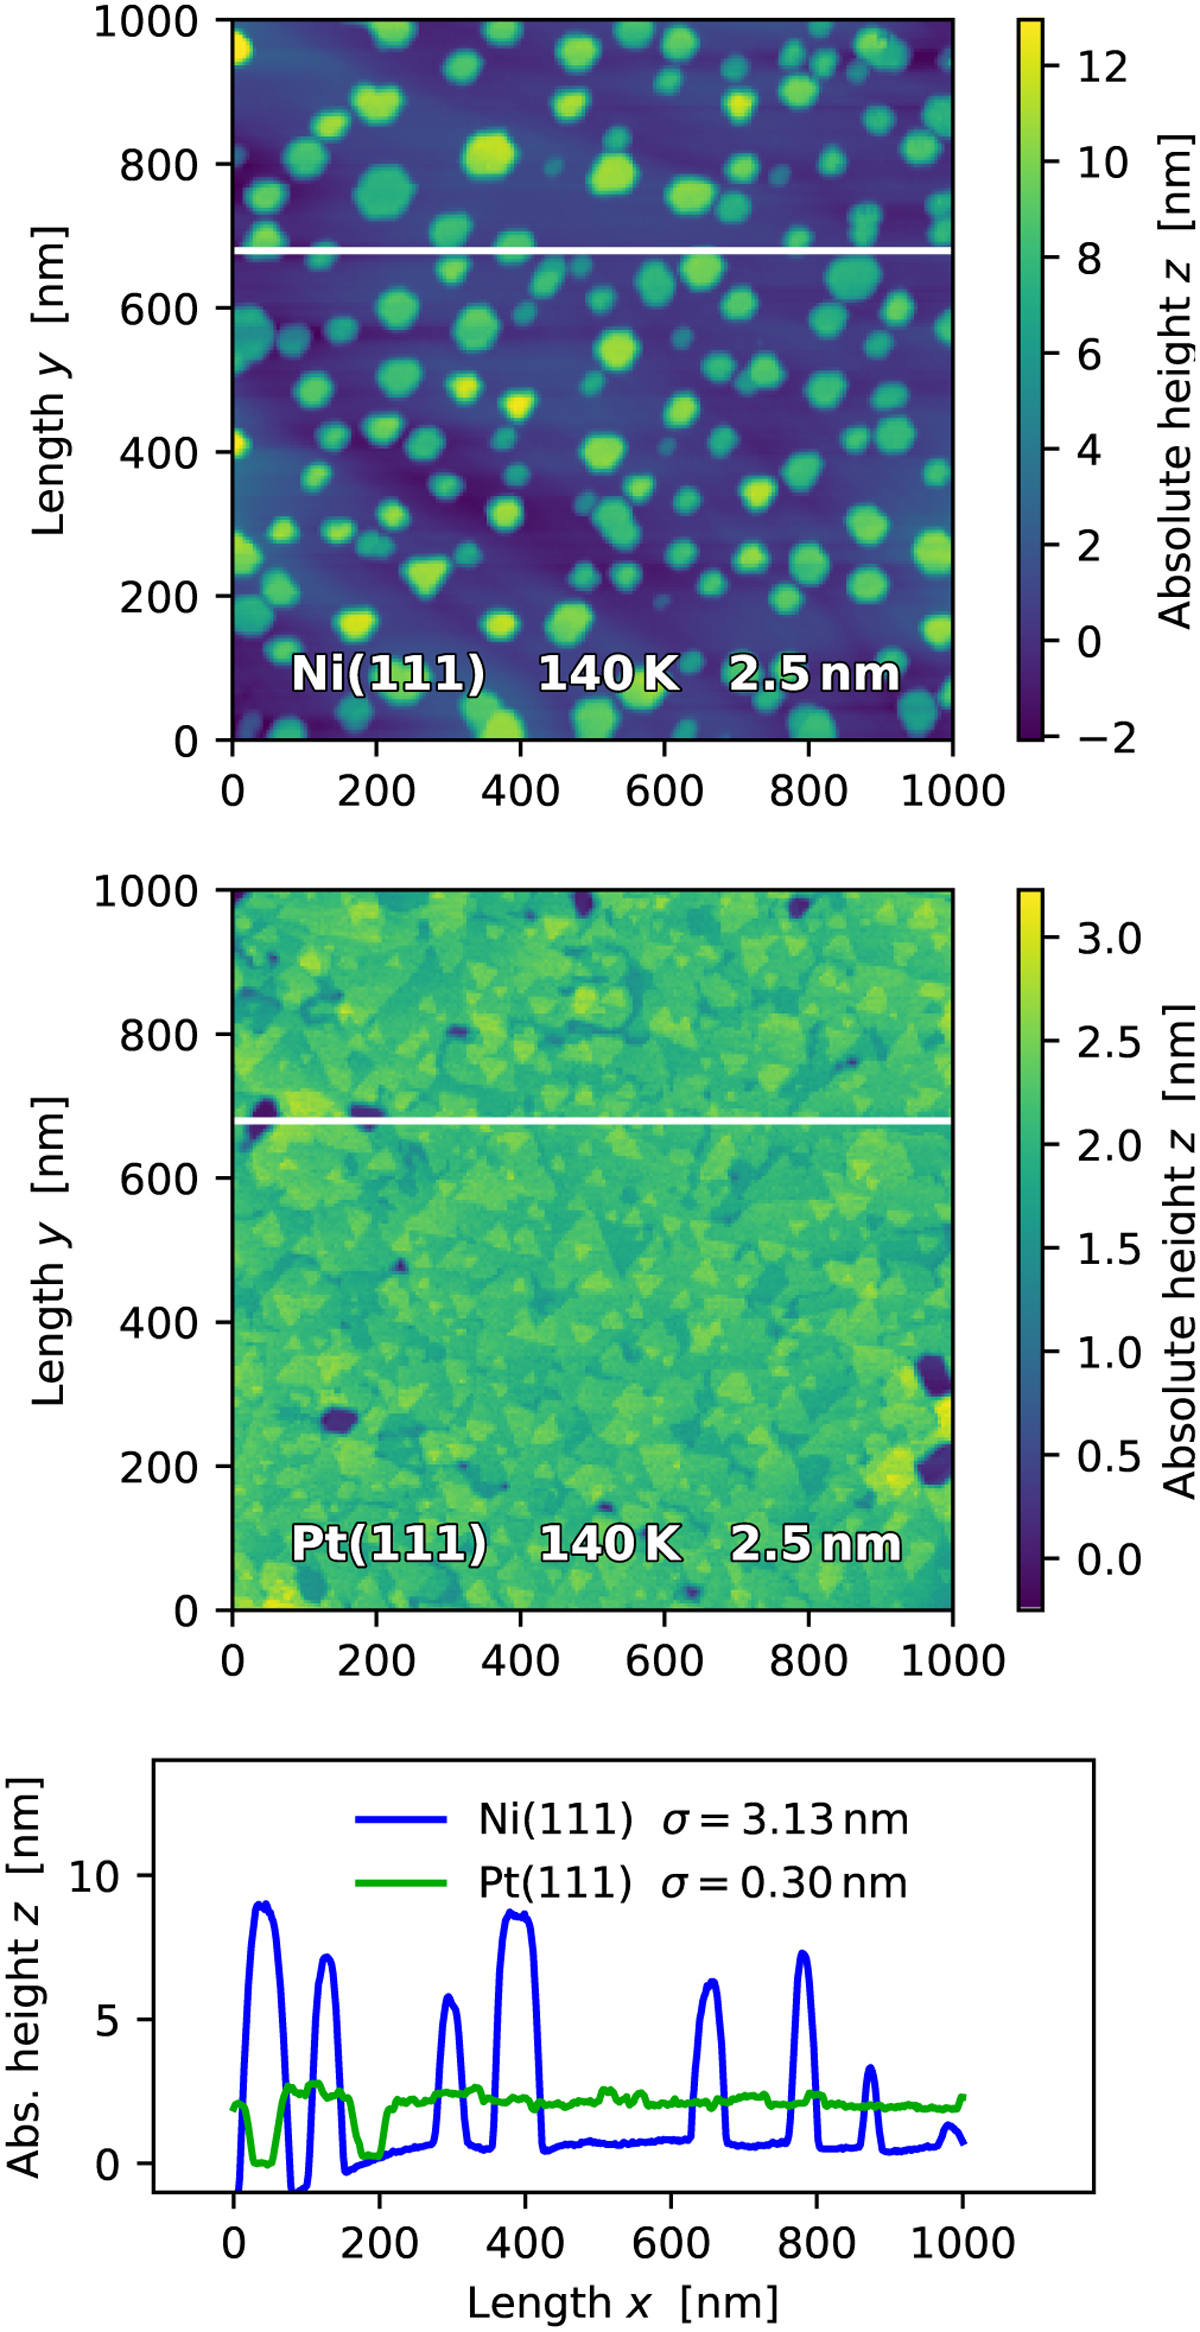
Effect of the substrate on ice topography, for an average amount of 2.5 nm ice. Top panel: on Ni(111), a wetting bilayer (dark blue) is formed, in which isolated crystallites grow in height that cover 15% of the surface area. Middle panel: on Pt(111), crystallites quickly overgrow each other, forming a contiguous film. The wetting monolayer (dark spots) is still exposed in a few places. Bottom panel: height profiles measured along the horizontal lines shown in the upper panels. The standard deviation of the height distribution for Ni(111) is ten times that of Pt(111). The profile of the Ni(111) crystallites is convolved with the width of the STM’s scanning tip; in reality, the walls of the crystallites are more vertical. To directly compare the height profiles, we plot the absolute height above a substrate mean reference, whereas in Fig. 10 we show the relative heights. The data for these plots were taken by Thürmer et al. (2014), who also inspired this figure.
Current usage metrics show cumulative count of Article Views (full-text article views including HTML views, PDF and ePub downloads, according to the available data) and Abstracts Views on Vision4Press platform.
Data correspond to usage on the plateform after 2015. The current usage metrics is available 48-96 hours after online publication and is updated daily on week days.
Initial download of the metrics may take a while.