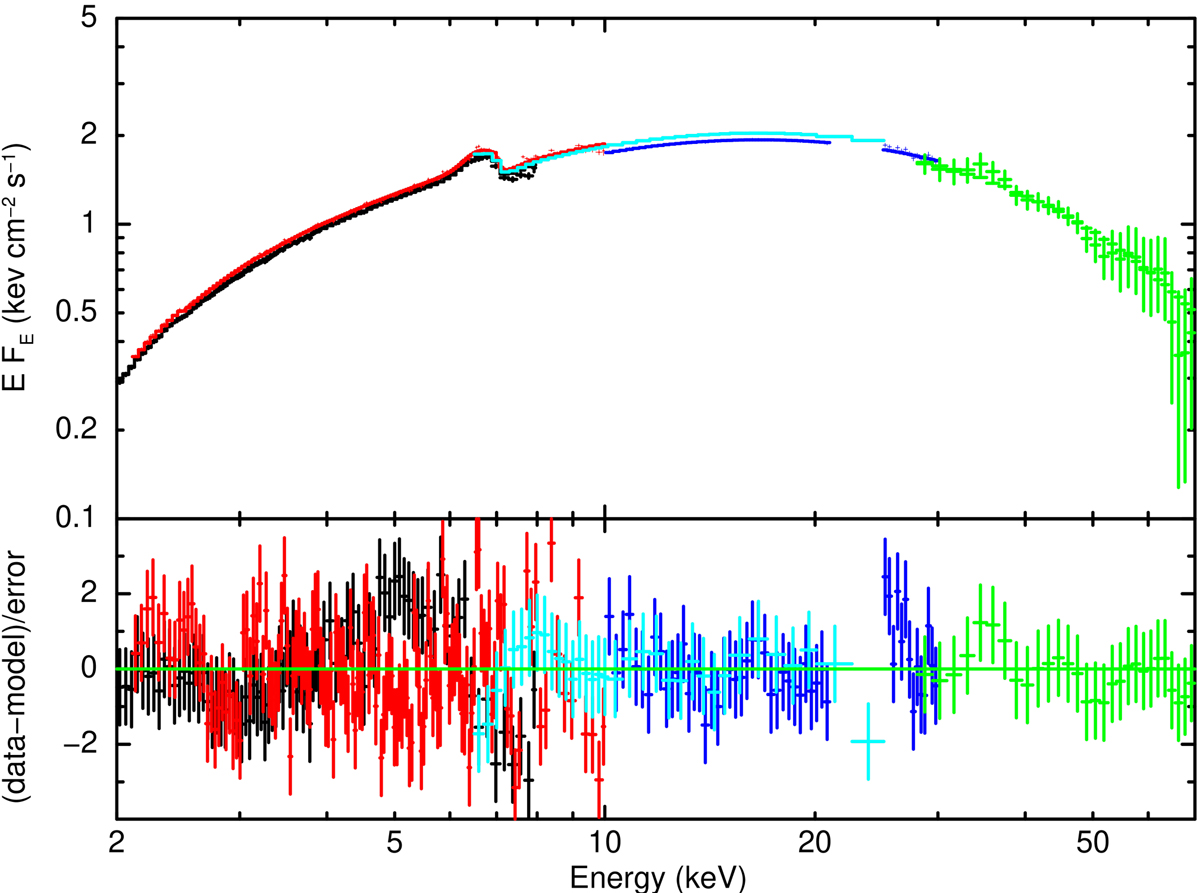
Fig. 5.
Download original image
Phase-averaged broadband spectrum of EXO 2030+375. Top: EXO 2030+375 unfolded EFE spectrum as observed by IXPE, HXMT, and ART-XC. For plotting purpose, data from the three IXPE DUs are combined and re-normalized, and all spectra are rebinned. IXPE data are in red, HXMT LE, ME, and HE in black, blue and green, respectively, ART-XC data are in cyan. Bottom: residuals of the best-fit model (also see Table 2).
Current usage metrics show cumulative count of Article Views (full-text article views including HTML views, PDF and ePub downloads, according to the available data) and Abstracts Views on Vision4Press platform.
Data correspond to usage on the plateform after 2015. The current usage metrics is available 48-96 hours after online publication and is updated daily on week days.
Initial download of the metrics may take a while.