Fig. 4.
Download original image
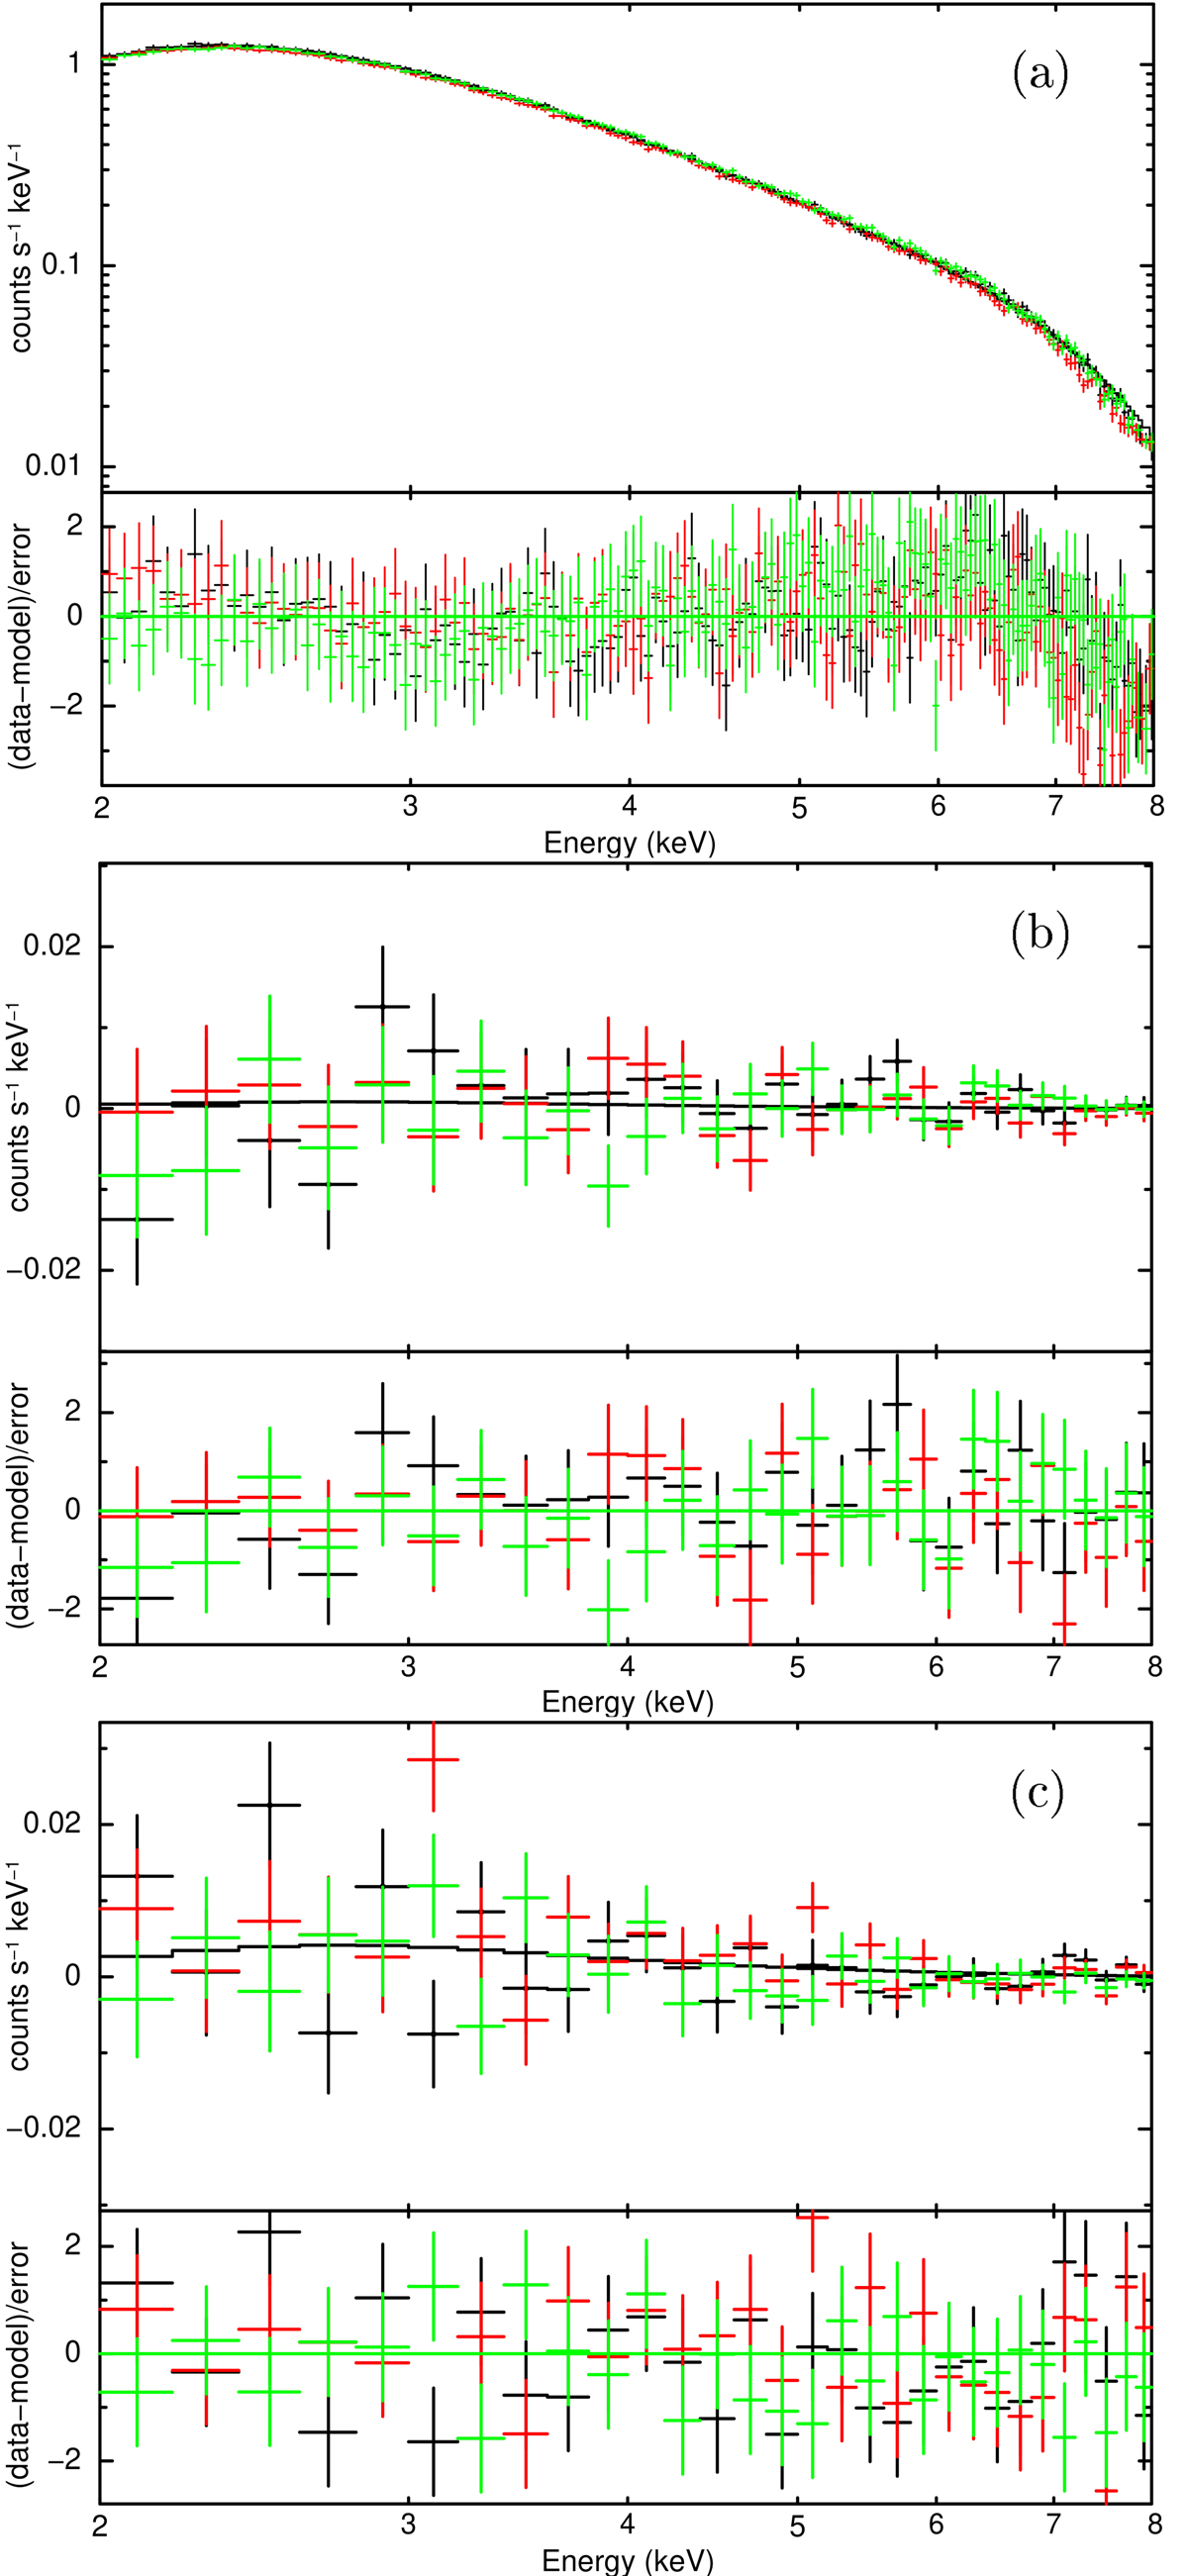
EXO 2030+375 spectral energy distribution of the phase-averaged Stokes parameters I, Q, and U as observed by IXPE – panels (a), (b), and (c), respectively. Continuous lines in the top panels represent the best-fit model const×tbabs(powerlaw×polconst) reported in Table 1. Bottom panels show the residuals. Different colors represent different detectors – black for DU1, red for DU2, and green for DU3. Data have been rebinned and re-normalized for plotting purpose.
Current usage metrics show cumulative count of Article Views (full-text article views including HTML views, PDF and ePub downloads, according to the available data) and Abstracts Views on Vision4Press platform.
Data correspond to usage on the plateform after 2015. The current usage metrics is available 48-96 hours after online publication and is updated daily on week days.
Initial download of the metrics may take a while.