Fig. 3
Download original image
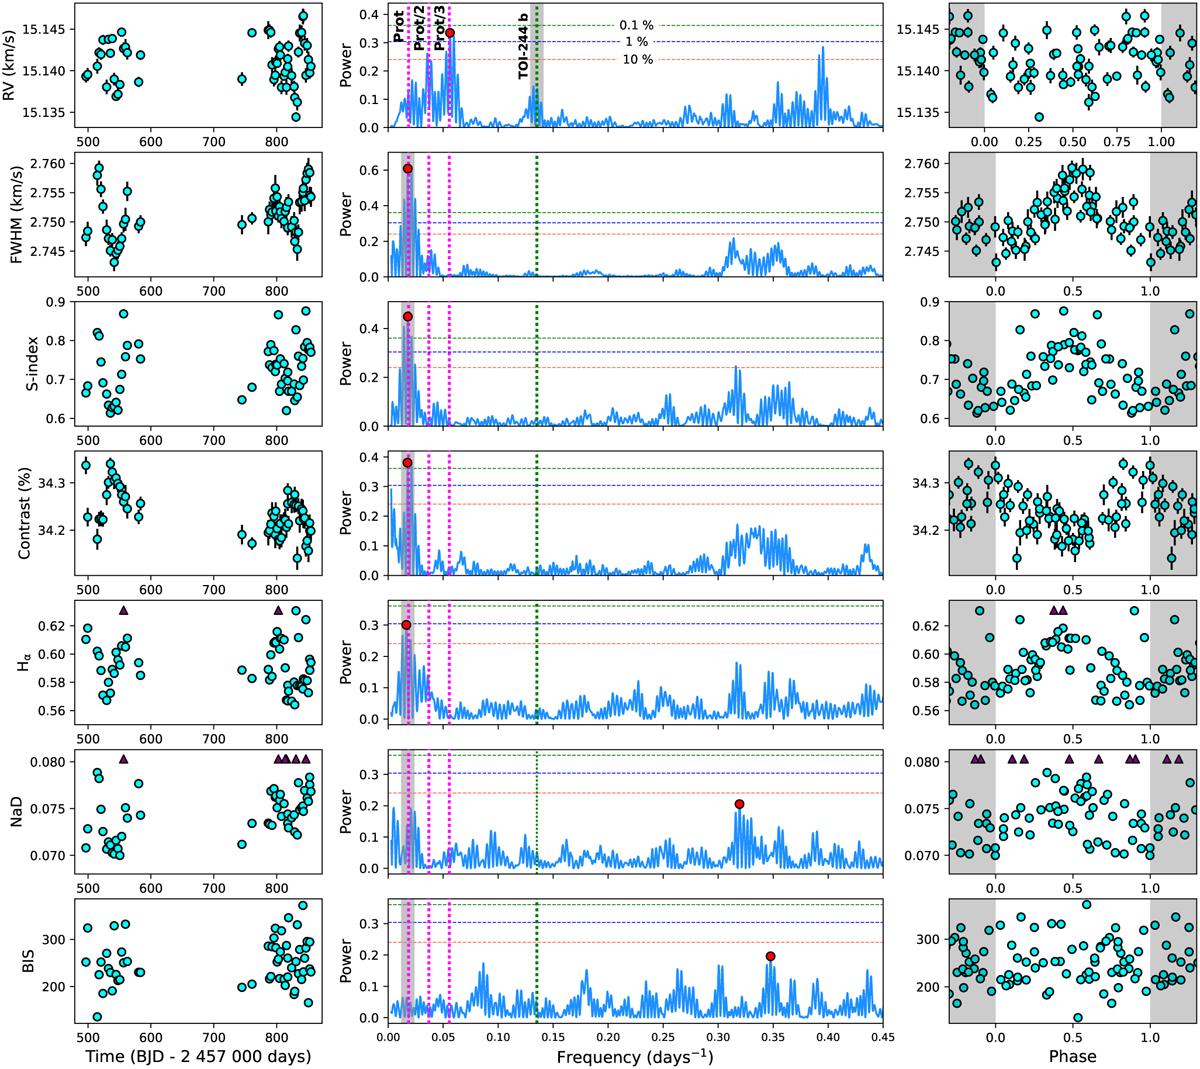
Left panel: time series of the ESPRESSO RVs and activity indicators. Center panel: GLS periodograms of the corresponding time series. The red circles highlight the maximum power frequencies. The green dotted vertical lines indicate location of the orbital period of TOI-244 b (Porb= 7.4 days). The magenta dotted vertical lines indicate the rotation period of the star identified in the activity indicators (Prot ~ 56 days) and its second and third harmonic. The gray vertical bands indicate the periods by which the time series in the right panel are folded. The horizontal dotted lines correspond to the 10 (orange), 1 (blue), and 0.1% (green) FAP levels. Right panel: ESPRESSO time series folded to the gray bands periods. The triangle markers within the left and right panels indicate the location of data points outside the boundaries of the plot.
Current usage metrics show cumulative count of Article Views (full-text article views including HTML views, PDF and ePub downloads, according to the available data) and Abstracts Views on Vision4Press platform.
Data correspond to usage on the plateform after 2015. The current usage metrics is available 48-96 hours after online publication and is updated daily on week days.
Initial download of the metrics may take a while.