Open Access
Fig. 1
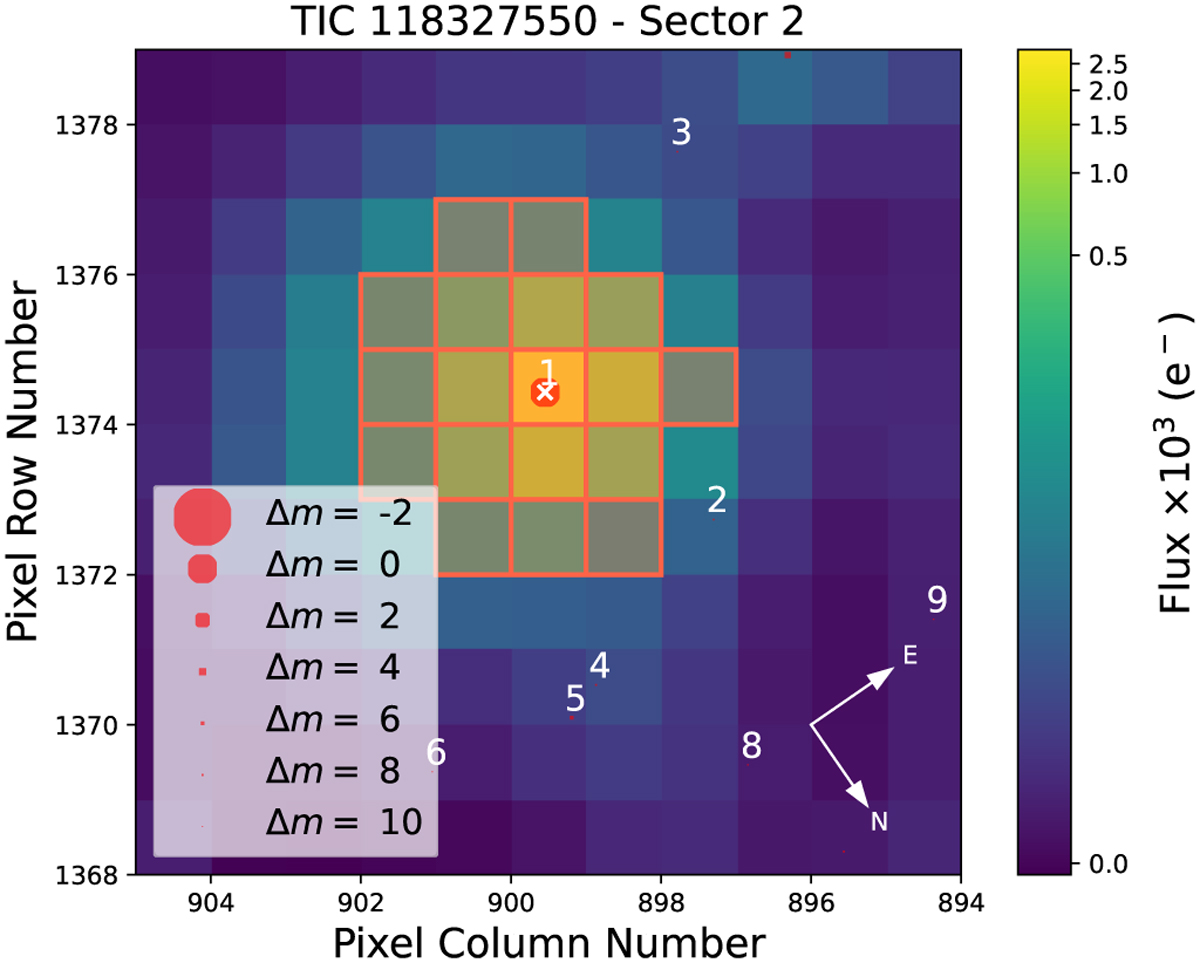
Download original image
TESS target pixel file of GJ 1018. The orange grid is the selected aperture and the red circles correspond to the nearby Gaia DR3 sources. Symbol sizes for Gaia sources scale to their G magnitudes. This plot has been prepared through tpfplotter (Aller et al. 2020).
Current usage metrics show cumulative count of Article Views (full-text article views including HTML views, PDF and ePub downloads, according to the available data) and Abstracts Views on Vision4Press platform.
Data correspond to usage on the plateform after 2015. The current usage metrics is available 48-96 hours after online publication and is updated daily on week days.
Initial download of the metrics may take a while.