Fig. D.1
Download original image
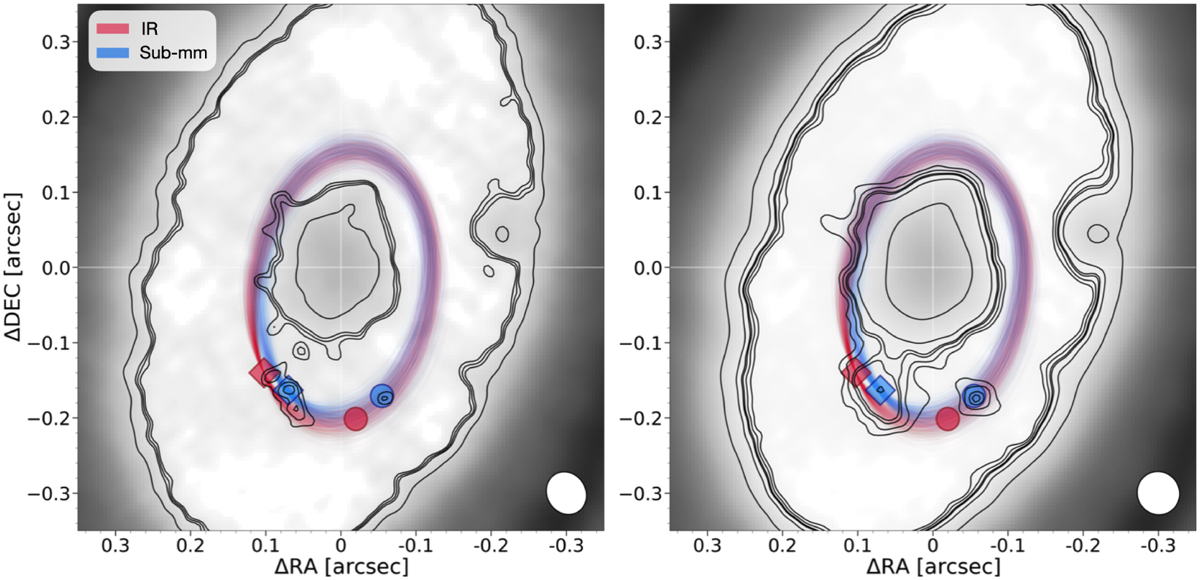
Same ALMA image and contours as in Fig. 1 (left) and Fig. C.1 (right, which is JvM corrected), but including the infrared position of planet PDS 70 b. Diamond markers indicate the infrared position of PDS 70 b (in red) and the maximum of the submillimeter emission associated with PDS 70 b (in blue). The orbits are restricted to those crossing the position of the markers in each case. The big solid circles represent the location of the L5 points associated with the infrared position of the planet (in red) and with the peak of the submillimeter emission (in blue), respectively.
Current usage metrics show cumulative count of Article Views (full-text article views including HTML views, PDF and ePub downloads, according to the available data) and Abstracts Views on Vision4Press platform.
Data correspond to usage on the plateform after 2015. The current usage metrics is available 48-96 hours after online publication and is updated daily on week days.
Initial download of the metrics may take a while.