Fig. A.1
Download original image
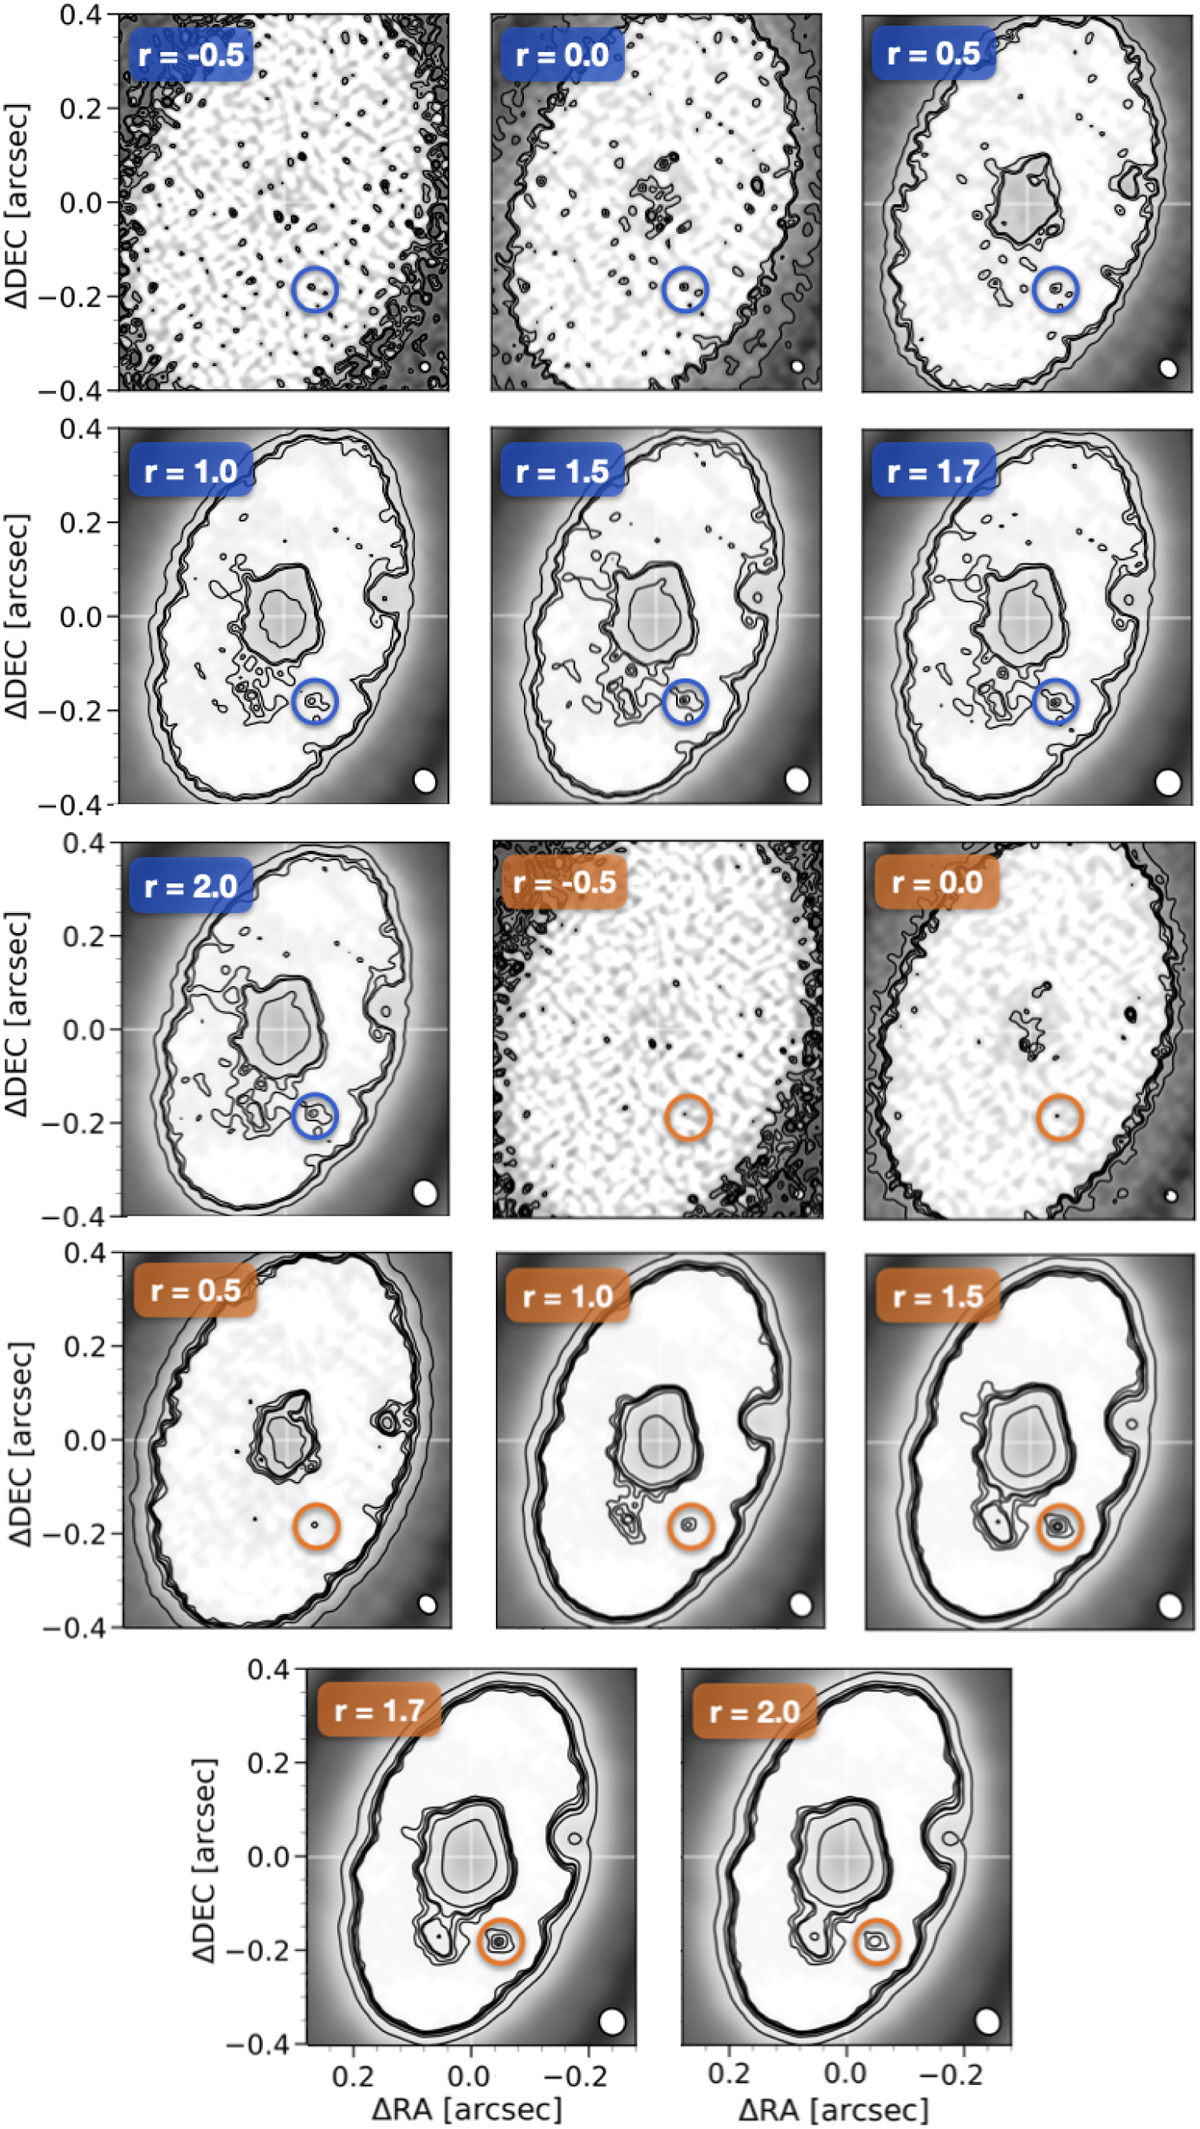
Gallery of images with different robust values as indicated in the upper left corner of each panel. The circle indicates the position of the L5b emission. Panels with blue colors correspond with the image without the JvM correction, whose contours are 2, 3, 3.5, and 8-σ. Panels with orange colors are JvM-corrected images and their contours indicate 3, 4, 5, 5.5, 8, and 22-σ.
Current usage metrics show cumulative count of Article Views (full-text article views including HTML views, PDF and ePub downloads, according to the available data) and Abstracts Views on Vision4Press platform.
Data correspond to usage on the plateform after 2015. The current usage metrics is available 48-96 hours after online publication and is updated daily on week days.
Initial download of the metrics may take a while.