Fig. 1
Download original image
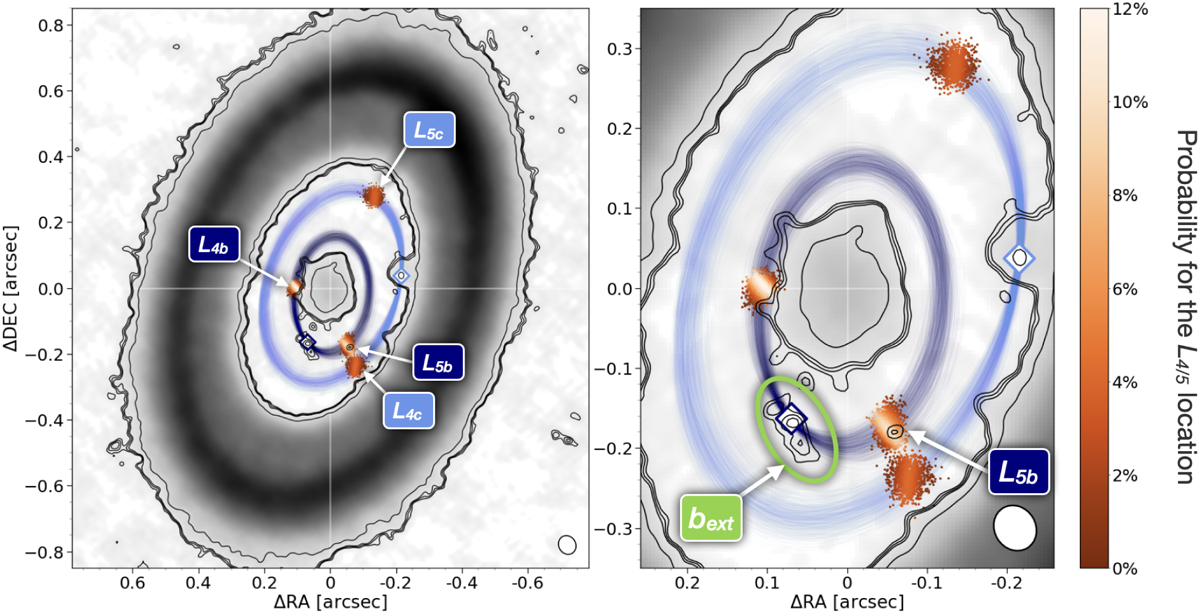
PDS 70 ALMA observations with the projected distributions of the projected planetary orbits and Lagrangian points (L4 and L5) distributions. The background image (inverted grayscale) corresponds to the continuum observations from the combined ALMA data (see Sect. 2). The locations for the corresponding L4/L5 points for each orbit (total of 103 for each planet) are plotted with dots, whose density is represented by the colors from the right-hand side bar (it is important to note that lighter colors denote a higher density of probability for the location). The origin of coordinates is shown with white lines. The synthesized beam (0.058″ × 0.052″, PA = 58.71°) is represented in the bottom right of each panel by a white ellipse. Diamond-shaped markers indicate the planets locations. Contours correspond to 3, 3.5, 4, and 8-σ. Left: global picture of PDS 70. Right: zoom of the inner cavity to inspect the L5 region of PDS 70 b. In green the extended emission associated with planet b reported by Isella et al. 2019 is indicated.
Current usage metrics show cumulative count of Article Views (full-text article views including HTML views, PDF and ePub downloads, according to the available data) and Abstracts Views on Vision4Press platform.
Data correspond to usage on the plateform after 2015. The current usage metrics is available 48-96 hours after online publication and is updated daily on week days.
Initial download of the metrics may take a while.