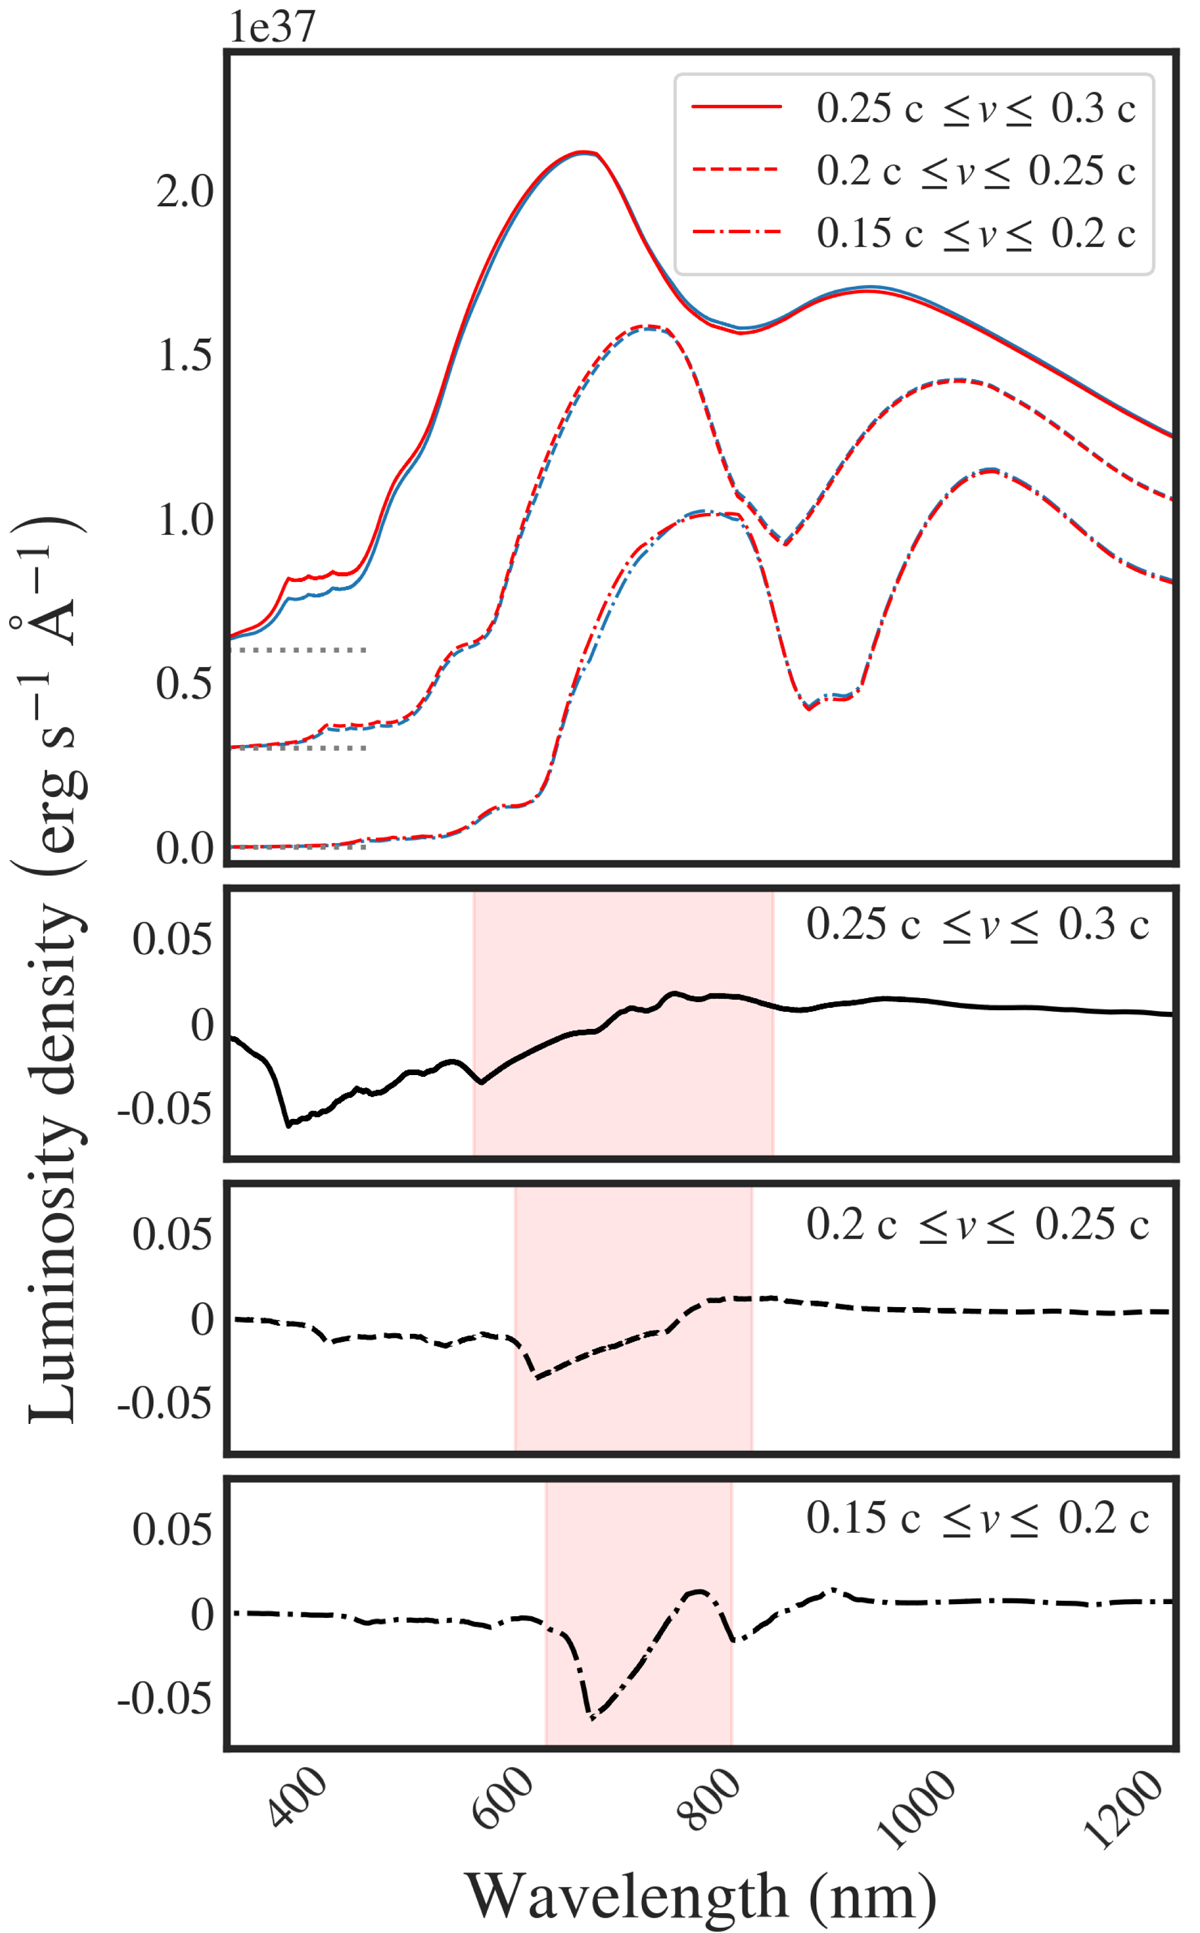
Fig. 7.
Download original image
Example TARDIS model spectra including yttrium (blue) and excluding yttrium (red) but otherwise composed of all r-process elements (33 ≤ Z ≤ 92) with solar r-process abundance ratios (Lodders et al. 2009; Bisterzo et al. 2014) for three different ejecta velocities. The three bottom panels show the difference in the spectral shape between the yttrium-free and yttrium-containing model for each characteristic velocity. Only when the characteristic ejecta velocity has decreased below ∼0.2c (at about 3–4 days post merger) does the P Cygni feature become apparent, because it no longer merges with lower-wavelength yttrium features.
Current usage metrics show cumulative count of Article Views (full-text article views including HTML views, PDF and ePub downloads, according to the available data) and Abstracts Views on Vision4Press platform.
Data correspond to usage on the plateform after 2015. The current usage metrics is available 48-96 hours after online publication and is updated daily on week days.
Initial download of the metrics may take a while.