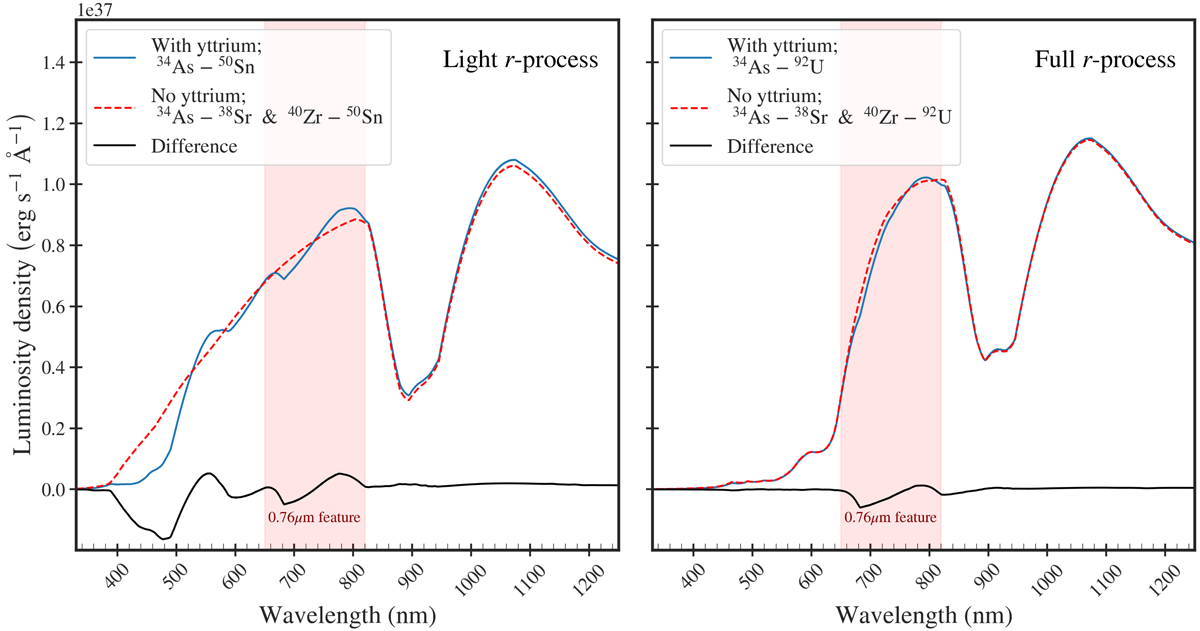
Fig. 6.
Download original image
Example TARDIS model spectra including yttrium (blue line) and excluding yttrium (red dashed line) but otherwise composed of r-process elements with solar r-process abundance ratios (Lodders et al. 2009; Bisterzo et al. 2014). The left panel is limited to the first r-process peak elements (34 ≤ Z ≤ 50), while the right panel shows a model with all r-process elements (33 ≤ Z ≤ 92). The spectrum at the photosphere is modelled as a blackbody, which is then propagated through a relativistically expanding atmosphere (0.15c ≤ v ≤ 0.2c) using the radiative transfer equations with a radially uniform composition using the Kurucz (2018) line list. The red region indicates the 760 nm feature, which is clearly associated with the presence of yttrium. The yttrium abundance in the model constitutes 0.8% of the total mass. The 0.8–1 μm feature is the Sr+ P Cygni feature (Watson et al. 2019).
Current usage metrics show cumulative count of Article Views (full-text article views including HTML views, PDF and ePub downloads, according to the available data) and Abstracts Views on Vision4Press platform.
Data correspond to usage on the plateform after 2015. The current usage metrics is available 48-96 hours after online publication and is updated daily on week days.
Initial download of the metrics may take a while.