Fig. 5.
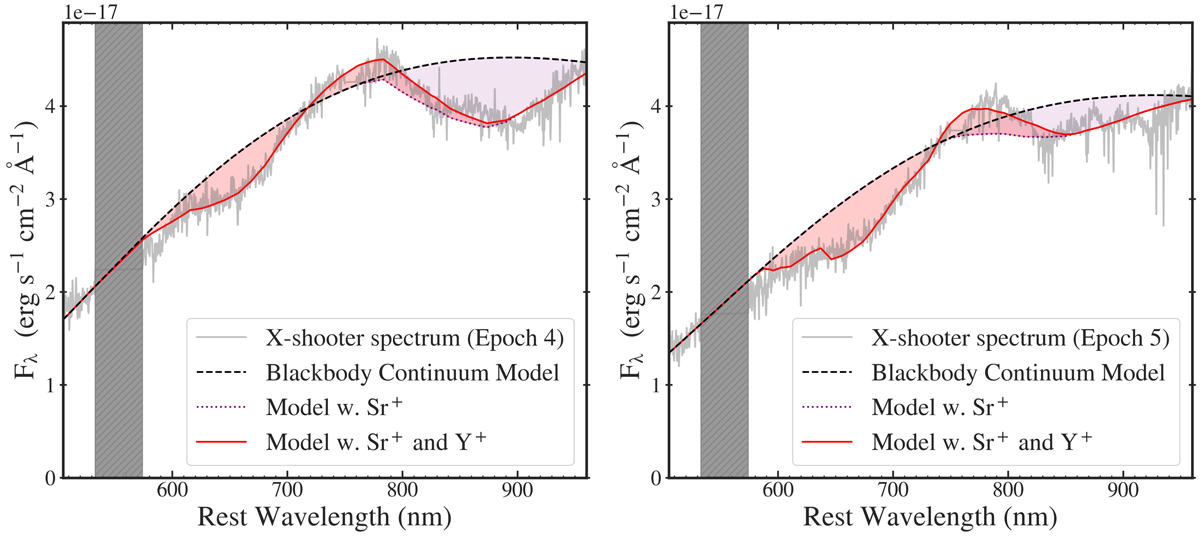
Download original image
X-shooter spectra with model fit including Y+ lines with λ ≥ 700 nm for epochs 4 and 5. The blackbody continuum model is shown as a dashed black line, the blackbody plus the Sr+ P Cygni lines as a dotted purple line, and the full model including both Sr+ and Y+ as a solid red line. The partially transparent purple and red regions indicate the successive contributions to these models of the Sr+ and Y+ P Cygni lines, respectively. The grey hatched region indicates the overlapping noisy regions between the UVB and VIS arms of the spectrograph. The Y+ lines (from the 4d2–4d5p transitions) have fixed central wavelengths and their relative strengths are set by the LTE condition.
Current usage metrics show cumulative count of Article Views (full-text article views including HTML views, PDF and ePub downloads, according to the available data) and Abstracts Views on Vision4Press platform.
Data correspond to usage on the plateform after 2015. The current usage metrics is available 48-96 hours after online publication and is updated daily on week days.
Initial download of the metrics may take a while.