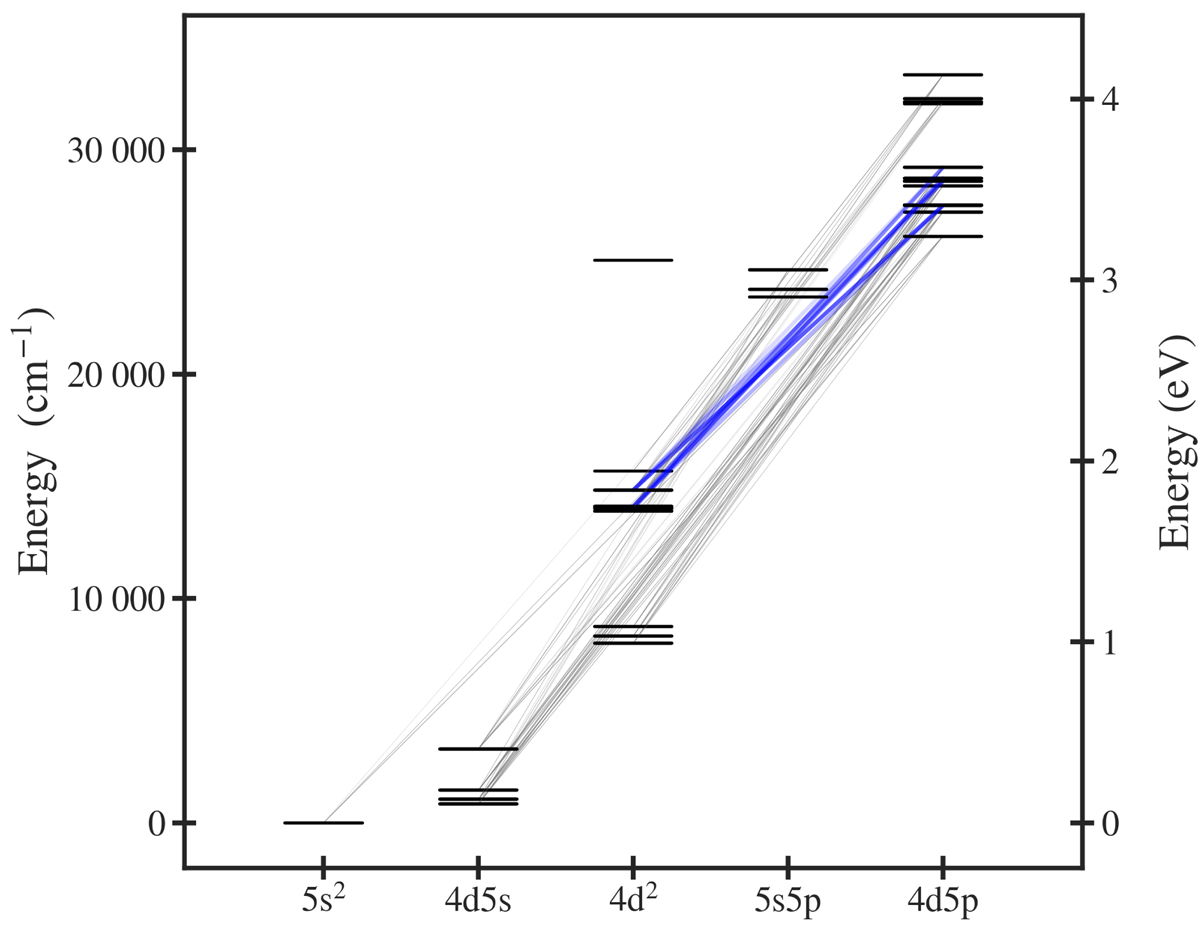
Fig. 4.
Download original image
Grotrian diagram showing the lowest energy levels in Y+. The transitions between energy levels are indicated, with the line transparency set by the transition strength, log gf. The 4d5p–4d2 (28 000 cm−1–14 000 cm−1) transitions are shown with thick lines in blue. Radiative transfer modelling analysis in Vieira et al. (2023) tentatively links the 4d5p–4d2 (28 000 cm−1–8000 cm−1) transitions to absorption at λ < 450 nm in the epoch 1 spectrum; other notable transitions are around 300 nm, too short to be observed by X-shooter (4d5p–4d5s, 28 000 cm−1–1000 cm−1), and signatures of the 5s5p–4d2 transitions (24 000 cm−1–14 000 cm−1) at 1 μm, which are much weaker than the Sr+ line transitions at similar wavelengths. The 4d5p–4d2 transitions have lower oscillator strength than several of the Y+ lines at shorter wavelengths, but due to the rapid decline of opacity with wavelength for typical r-process elements, these transitions have higher opacity compared to the continuum at 760 nm. When no lines are drawn between levels, the transition is negligible with log gf < −2.
Current usage metrics show cumulative count of Article Views (full-text article views including HTML views, PDF and ePub downloads, according to the available data) and Abstracts Views on Vision4Press platform.
Data correspond to usage on the plateform after 2015. The current usage metrics is available 48-96 hours after online publication and is updated daily on week days.
Initial download of the metrics may take a while.