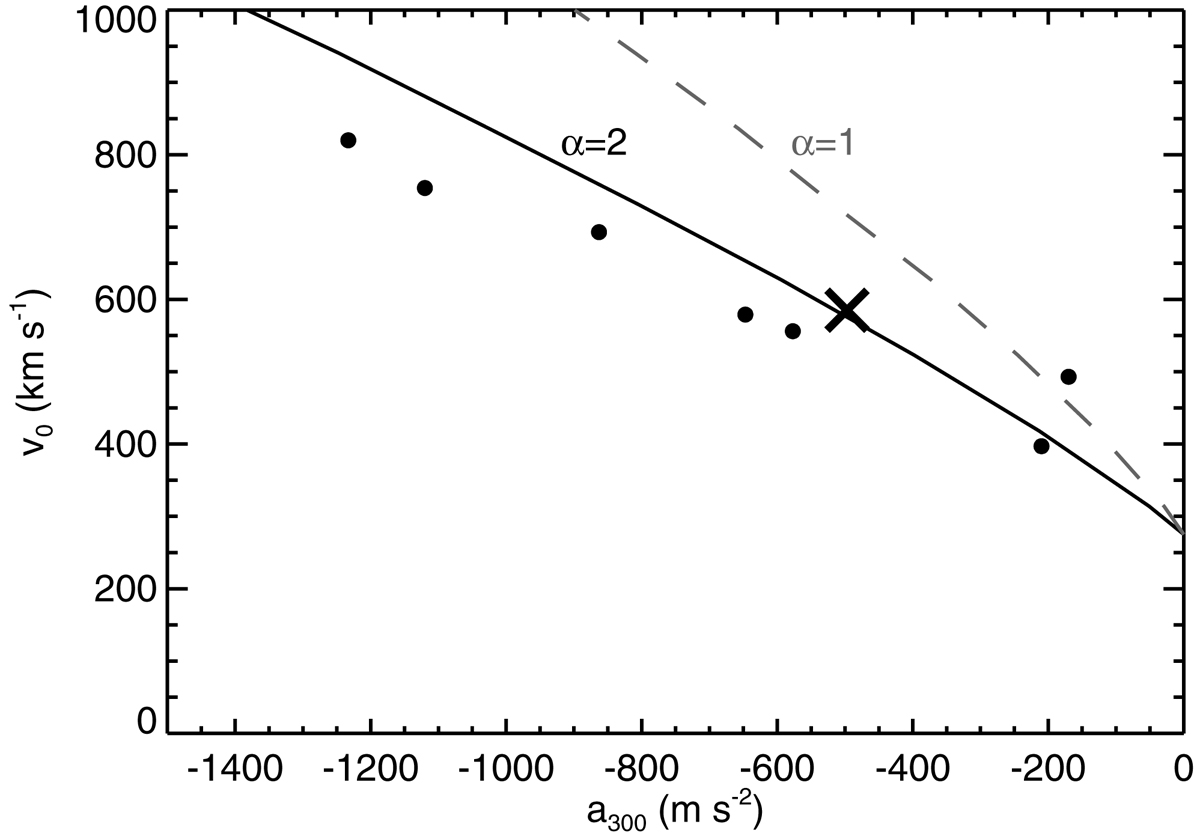
Fig. 3.

Download original image
Relationship between the initial velocity v0 and the initial deceleration a300 as obtained by the procedure described in Sect. 4 for α = 1 (dashed line) and α = 2 (full line). The pairs of values (a300, v0) derived from the sample of seven EUV waves (see Table 2) are inserted as bold dots. The cross denotes the pair (a300, v0) obtained for the representative EUV wave described in Sect. 2 (see Fig. 1).
Current usage metrics show cumulative count of Article Views (full-text article views including HTML views, PDF and ePub downloads, according to the available data) and Abstracts Views on Vision4Press platform.
Data correspond to usage on the plateform after 2015. The current usage metrics is available 48-96 hours after online publication and is updated daily on week days.
Initial download of the metrics may take a while.


