Fig. 3
Download original image
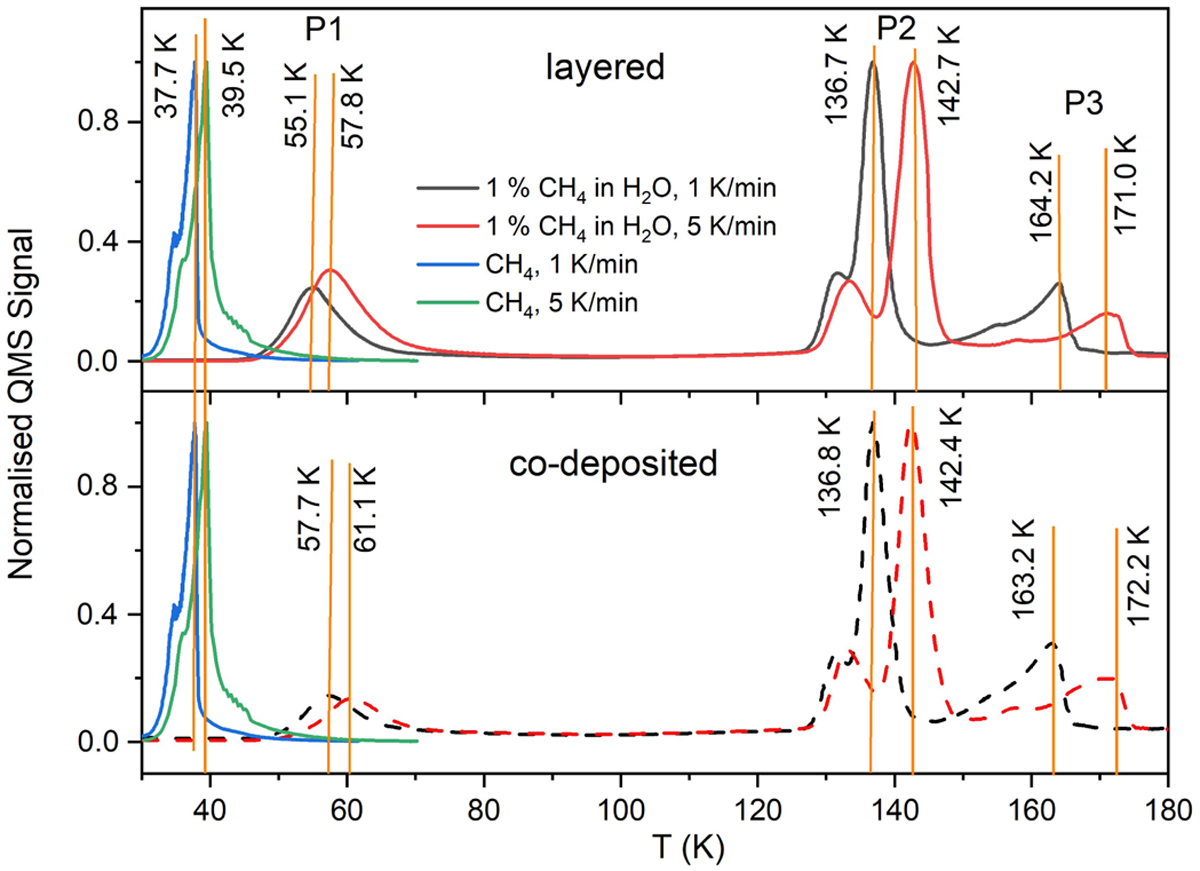
TPD curves of CH4, normalized to P2, for different heating ramps and H2O:CH4 ice mixture morphologies. TPDs of pure CH4 ices are also shown, in green and blue, in both panels for reference. Dashed lines indicate co-deposited cases and solid lines indicate layered ones. Black lines are for a 1 K min−1 heating ramp, and red ones are for a 5 K min−1 heating ramp.
Current usage metrics show cumulative count of Article Views (full-text article views including HTML views, PDF and ePub downloads, according to the available data) and Abstracts Views on Vision4Press platform.
Data correspond to usage on the plateform after 2015. The current usage metrics is available 48-96 hours after online publication and is updated daily on week days.
Initial download of the metrics may take a while.