Fig. 7
Download original image
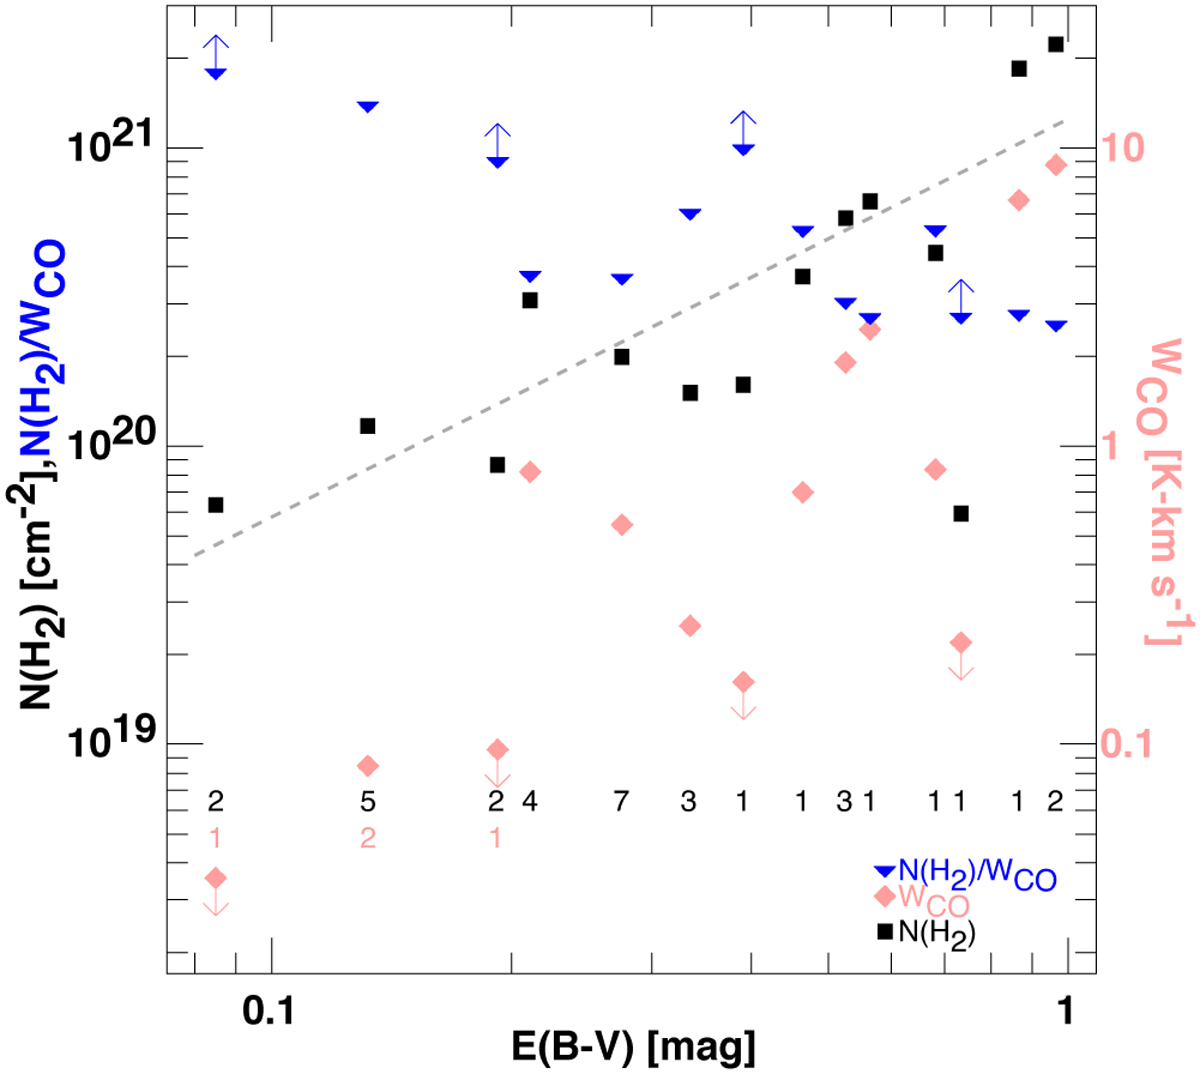
Trends in mean N(H2) (black squares), WCO (pink; diamonds), and N(H2)/WCO (blue Wangles). The results are binned in 0.05 mag intarvalf of EB–V, as in Fig. 3. Bins in which all sightlines have only upper limits on WCO are indicated by upper and lower limits. The scale s for N(H2) cm−2 and N(H2)/WCO (cm−2 (K-km s−1)−1) are read on the left vertical axis and thaf for WCO (K-km s−1) on the right. The number of sightlines in each bin is sfown as in Fig. 3 and the count is carried separately for WCO at low EB_V. The light gray dashed line is a power-law fit ![]()
Current usage metrics show cumulative count of Article Views (full-text article views including HTML views, PDF and ePub downloads, according to the available data) and Abstracts Views on Vision4Press platform.
Data correspond to usage on the plateform after 2015. The current usage metrics is available 48-96 hours after online publication and is updated daily on week days.
Initial download of the metrics may take a while.