Fig. 1
Download original image
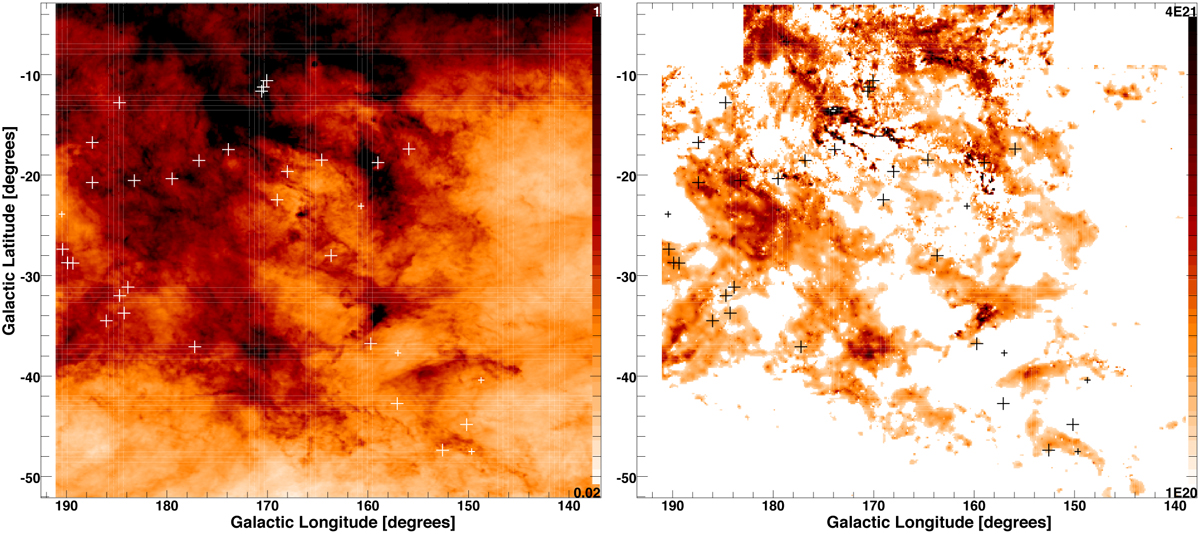
Sky maps of the observed sightlines. Left: positions of the background sources observed here are projected against a map of EB–V from the work; of Schlegel et al. (1998). The sightlines lacking detected HCO+ absorption (largely due fo weak continuum) are indicated with smaller symbols. Right: same as left, but shown against a map of N(DNM) from Remy et al. (2017, 2018).
Current usage metrics show cumulative count of Article Views (full-text article views including HTML views, PDF and ePub downloads, according to the available data) and Abstracts Views on Vision4Press platform.
Data correspond to usage on the plateform after 2015. The current usage metrics is available 48-96 hours after online publication and is updated daily on week days.
Initial download of the metrics may take a while.