Fig. 8.
Download original image
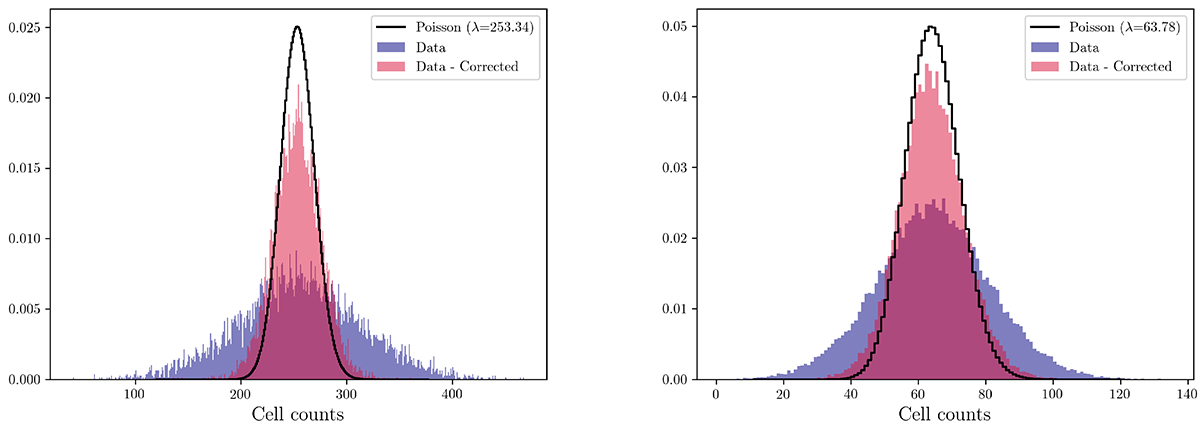
Cell count distribution for Nside = 32 (left) and Nside = 64 (right) RACS maps without any flux density cuts applied. Raw counts are shown (blue histogram) alongside the counts corrected for the power-law fit (red histogram). A Poisson distribution with a λ equivalent to the estimated monopole amplitude is also shown (black histogram).
Current usage metrics show cumulative count of Article Views (full-text article views including HTML views, PDF and ePub downloads, according to the available data) and Abstracts Views on Vision4Press platform.
Data correspond to usage on the plateform after 2015. The current usage metrics is available 48-96 hours after online publication and is updated daily on week days.
Initial download of the metrics may take a while.