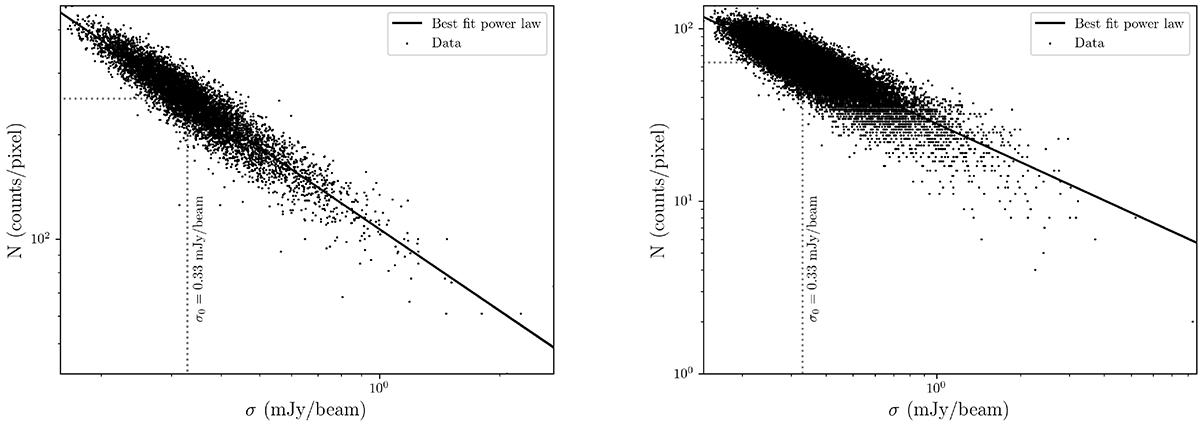
Fig. 6.
Download original image
Cell counts of the Nside = 32 (left) and Nside = 64 (right) HEALP IX maps with no flux density cuts applied, as a function of the median rms of the pixels, along with the best-fit power-law model (black solid line). The determined σ0 is indicated by the dashed vertical line; it intercepts the power law at the best-fit monopole value indicated by the horizontal dashed line.
Current usage metrics show cumulative count of Article Views (full-text article views including HTML views, PDF and ePub downloads, according to the available data) and Abstracts Views on Vision4Press platform.
Data correspond to usage on the plateform after 2015. The current usage metrics is available 48-96 hours after online publication and is updated daily on week days.
Initial download of the metrics may take a while.