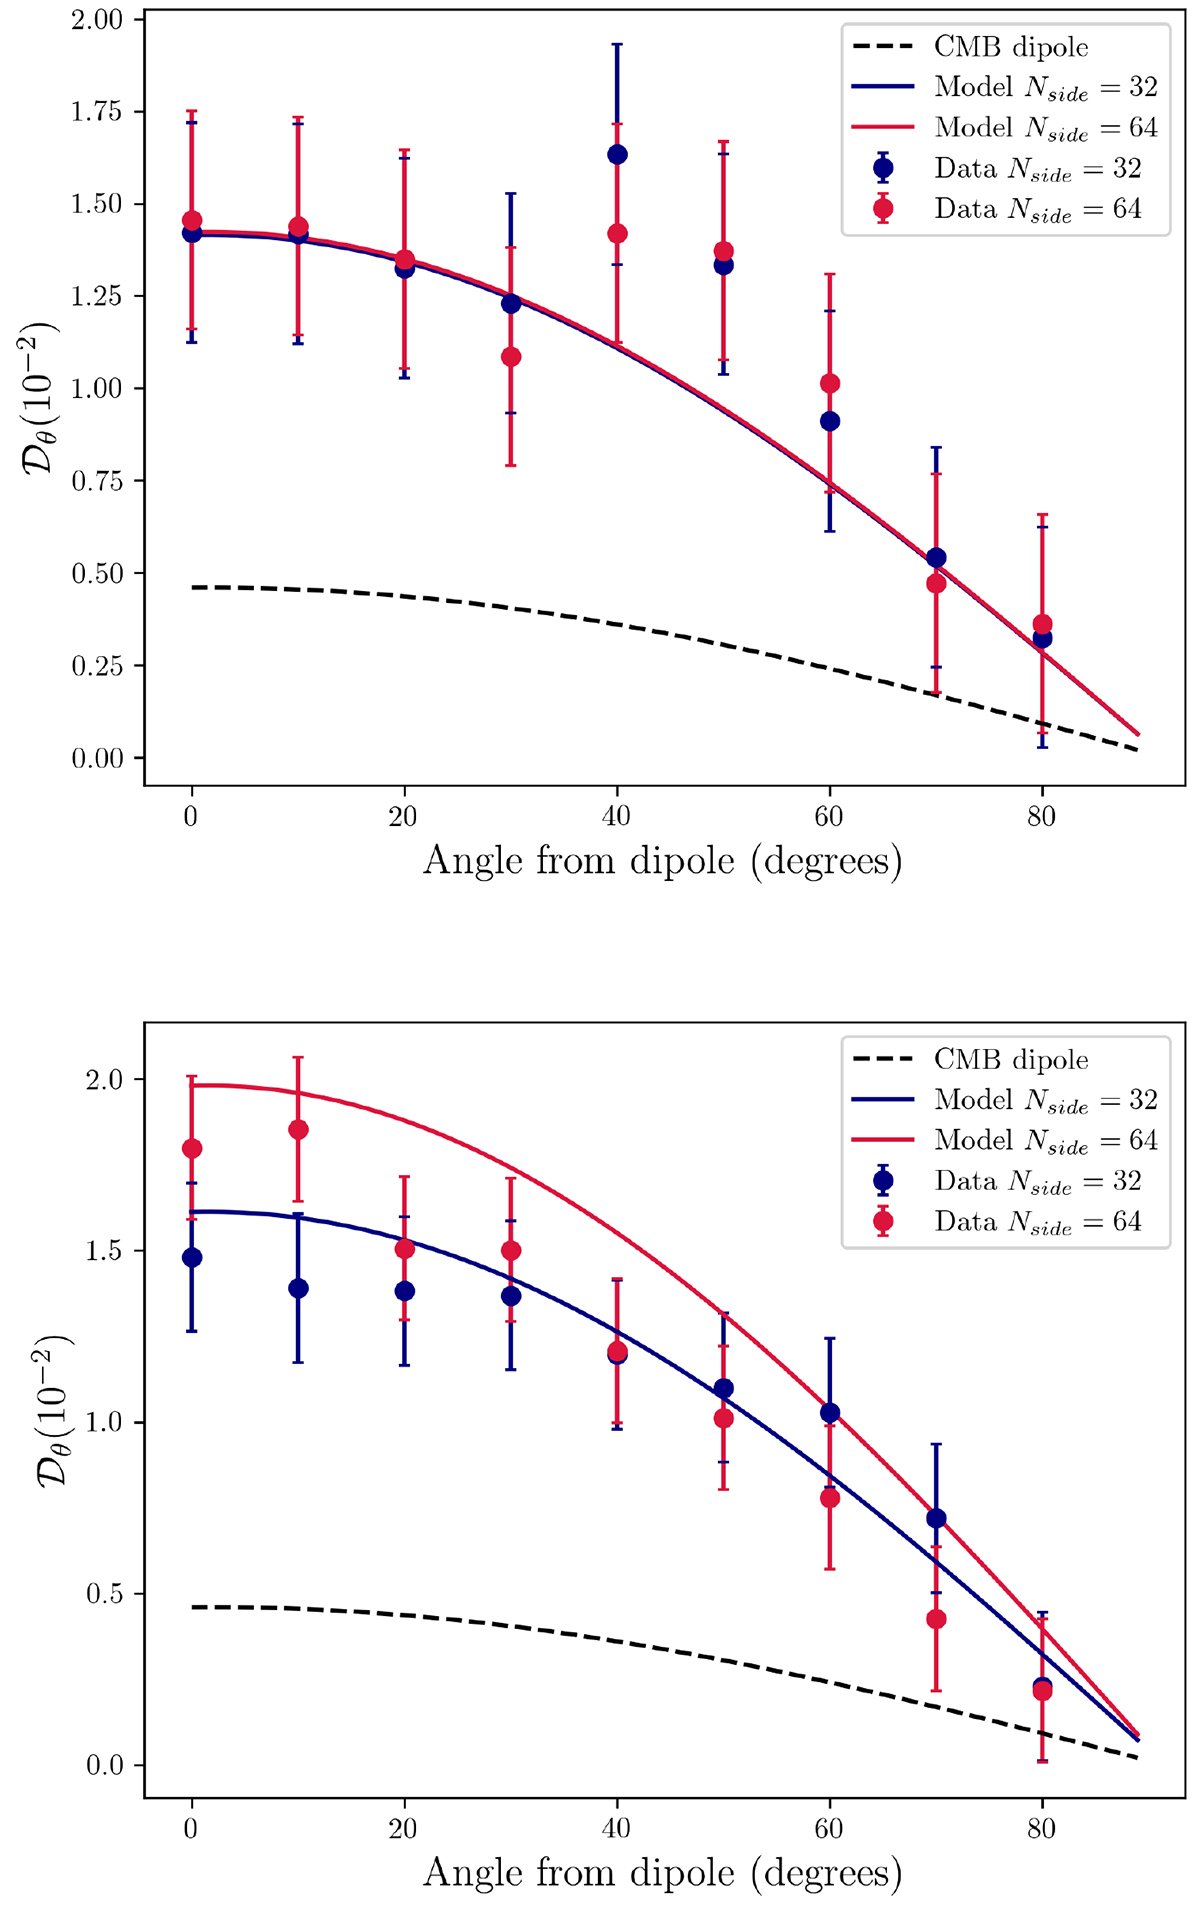
Fig. 10.
Download original image
Dipole amplitude of RACS as a function of angular distance to the dipole direction, assuming a best-fit dipole direction from the basic Poisson estimator (top) and Poisson rms estimator (bottom). Results for both Nside = 32 (blue) and Nside = 64 (red) maps are shown. Alongside the data, the corresponding models are plotted (solid lines), as well as the expected model from the CMB dipole (black dashed line).
Current usage metrics show cumulative count of Article Views (full-text article views including HTML views, PDF and ePub downloads, according to the available data) and Abstracts Views on Vision4Press platform.
Data correspond to usage on the plateform after 2015. The current usage metrics is available 48-96 hours after online publication and is updated daily on week days.
Initial download of the metrics may take a while.