Fig. A.2
Download original image
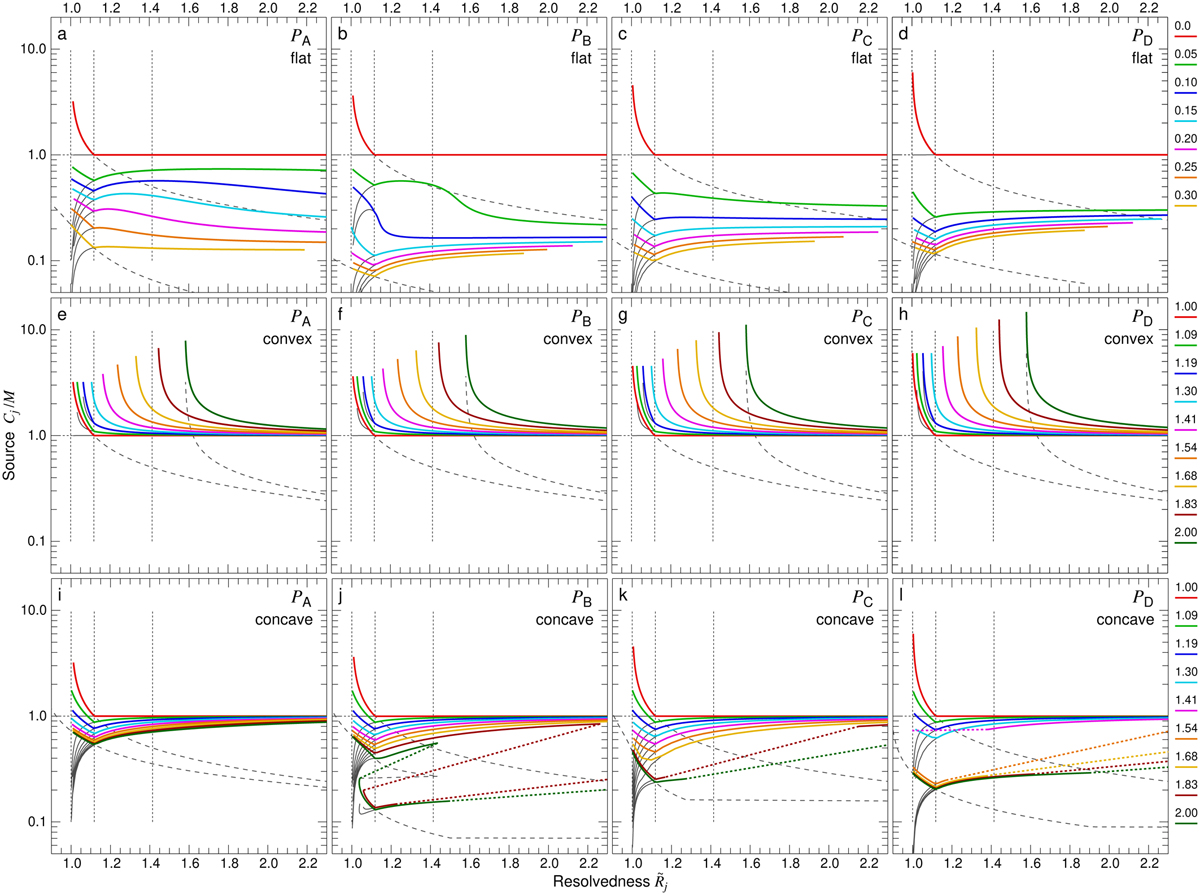
Deconvolution accuracy of the moment sizes ![]() for the power-law sources
for the power-law sources ![]() and
and ![]() (Eq. (8)), separated from the flat (top), convex (middle), and concave (bottom) backgrounds, for background over-subtraction levels 0 ≤ ϵl ≤ 0.3 and size factors 1 ≤ fk ≤ 2. The ratio of the modified deconvolved sizes Cj to the true model size M (Table 1) is plotted as a function of the source resolvedness
(Eq. (8)), separated from the flat (top), convex (middle), and concave (bottom) backgrounds, for background over-subtraction levels 0 ≤ ϵl ≤ 0.3 and size factors 1 ≤ fk ≤ 2. The ratio of the modified deconvolved sizes Cj to the true model size M (Table 1) is plotted as a function of the source resolvedness ![]() . The dashed curves indicate discontinuous jumps in
. The dashed curves indicate discontinuous jumps in ![]() between j and j + 1 (at certain Oj values), caused by the jumps in the footprint radii Θℳjk- (Eq. (7)) and sizes
between j and j + 1 (at certain Oj values), caused by the jumps in the footprint radii Θℳjk- (Eq. (7)) and sizes ![]() (cf. Fig. A.3). For reference, the thin black curves display Dj/M and the dashed curves visualize (Oj/2)/M for ϵl = {0, 0.3} and fk = {1, 2}. Corresponding plots for the deconvolved half maximum sizes
(cf. Fig. A.3). For reference, the thin black curves display Dj/M and the dashed curves visualize (Oj/2)/M for ϵl = {0, 0.3} and fk = {1, 2}. Corresponding plots for the deconvolved half maximum sizes ![]() are presented in Fig. 6.
are presented in Fig. 6.
Current usage metrics show cumulative count of Article Views (full-text article views including HTML views, PDF and ePub downloads, according to the available data) and Abstracts Views on Vision4Press platform.
Data correspond to usage on the plateform after 2015. The current usage metrics is available 48-96 hours after online publication and is updated daily on week days.
Initial download of the metrics may take a while.