Fig. 14
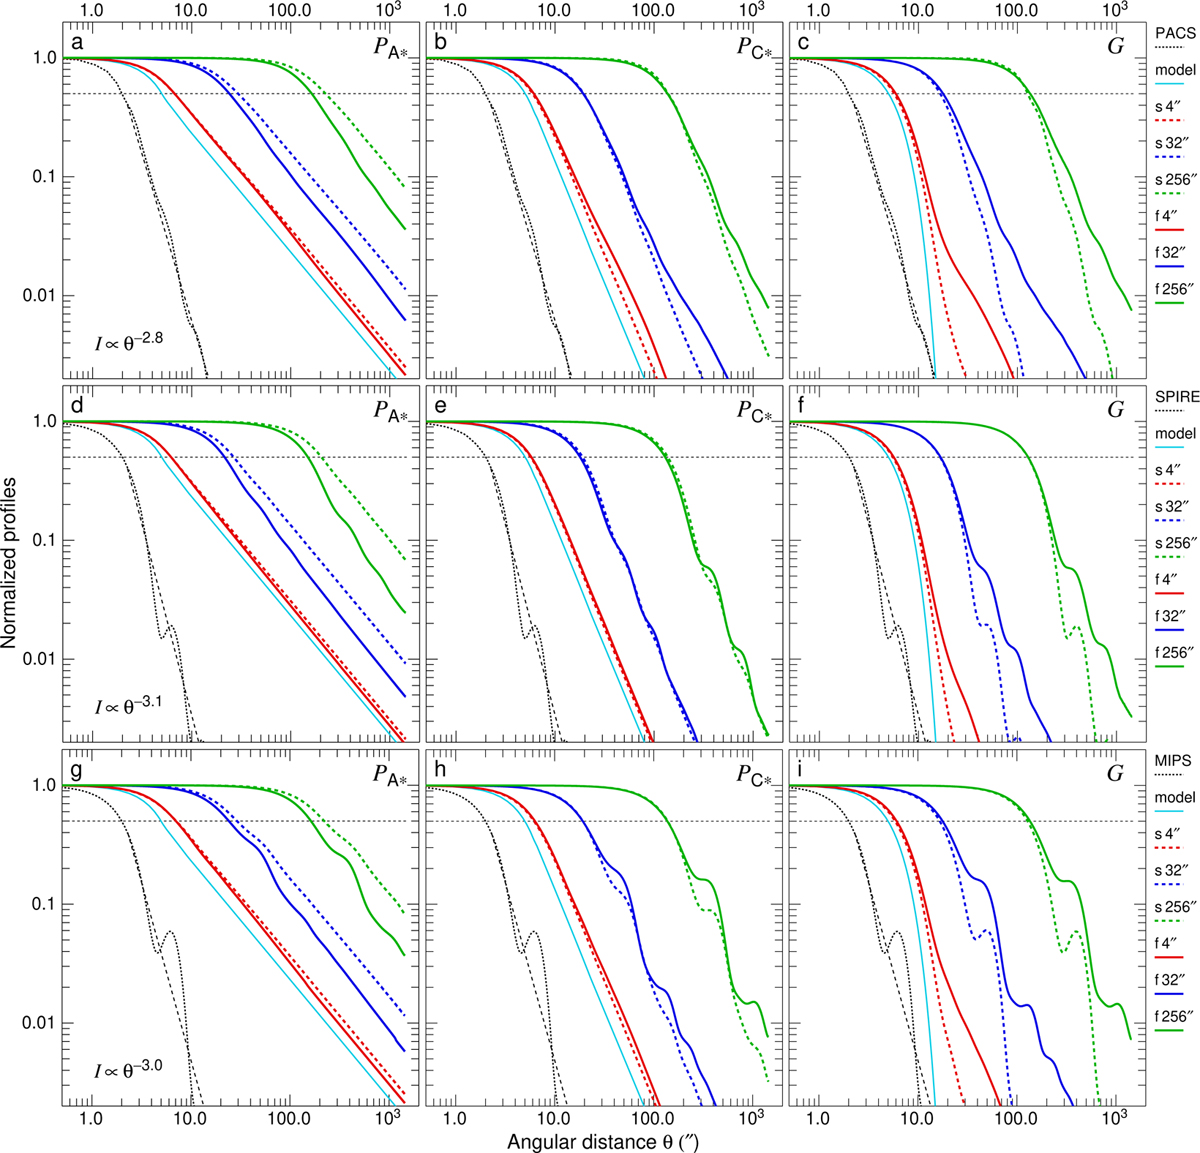
Download original image
Convolution of the Gaussian and infinite power-law models. The spherical (dashed curves) and cylindrical (solid curves) models from Figs. 11 and 12, were convolved with two kernels (thin dotted curves) of the half maximum sizes of {4, 32, 256}″, with the PSF shapes (Aniano et al. 2011) of Herschel PACS at 70 µm (top), Herschel SPIRE at 250 µm (middle), and Spitzer MIPS at 160 µm (bottom). The black dashed lines visualize the approximate power-law slopes of the PSFs, derived by a visual fitting of their profiles over 5 orders of magnitude. The dashed horizontal lines indicate the half maximum level.
Current usage metrics show cumulative count of Article Views (full-text article views including HTML views, PDF and ePub downloads, according to the available data) and Abstracts Views on Vision4Press platform.
Data correspond to usage on the plateform after 2015. The current usage metrics is available 48-96 hours after online publication and is updated daily on week days.
Initial download of the metrics may take a while.