Fig. 10
Download original image
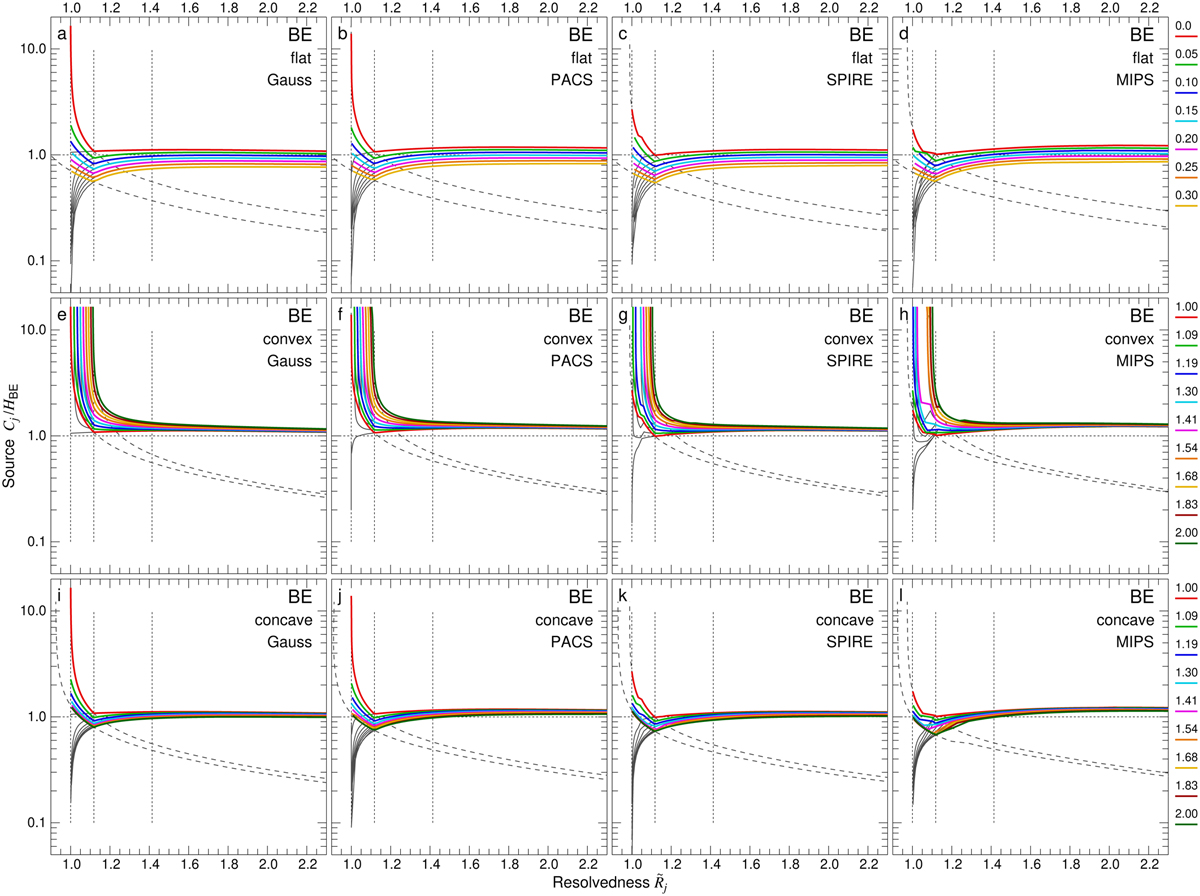
Deconvolution accuracy of the half maximum sizes ![]() for the critical Bonnor-Ebert sphere (Fig. 4), separated from the flat (top), convex (middle), and concave (bottom) backgrounds, for background over-subtraction levels 0 ≤ ϵl ≤ 0.3 and size factors 1 ≤ ƒk ≤ 2. The convolution kernels, besides a Gaussian shape, assumed the PSF shapes of Berschel PACS at 160 µm, Berschel SPIRE at 250 µm, and Spitzer MIPS at 160 µm (Aniano et al. 2011) with progressively larger deviations from the Gaussian shape. The ratio of the modified deconvolved sizes Cj to the true model size HBE = 10″ is plotted as a function of the source resolvedness
for the critical Bonnor-Ebert sphere (Fig. 4), separated from the flat (top), convex (middle), and concave (bottom) backgrounds, for background over-subtraction levels 0 ≤ ϵl ≤ 0.3 and size factors 1 ≤ ƒk ≤ 2. The convolution kernels, besides a Gaussian shape, assumed the PSF shapes of Berschel PACS at 160 µm, Berschel SPIRE at 250 µm, and Spitzer MIPS at 160 µm (Aniano et al. 2011) with progressively larger deviations from the Gaussian shape. The ratio of the modified deconvolved sizes Cj to the true model size HBE = 10″ is plotted as a function of the source resolvedness ![]() . Some curves display small irregularities in their shapes, similar to the jumps appearing in Fig. A.2, discussed in Sect. 3.2. They are also caused by the appearance of the secondary minima in the source profiles, induced by the wavy profiles of the PSFs (Fig. 14). For reference, the thin black curves display Dj/HBE and the dashed curves visualize (Oj/2)/HBE for ϵl = {0,0.3} and fk = {1,2}.
. Some curves display small irregularities in their shapes, similar to the jumps appearing in Fig. A.2, discussed in Sect. 3.2. They are also caused by the appearance of the secondary minima in the source profiles, induced by the wavy profiles of the PSFs (Fig. 14). For reference, the thin black curves display Dj/HBE and the dashed curves visualize (Oj/2)/HBE for ϵl = {0,0.3} and fk = {1,2}.
Current usage metrics show cumulative count of Article Views (full-text article views including HTML views, PDF and ePub downloads, according to the available data) and Abstracts Views on Vision4Press platform.
Data correspond to usage on the plateform after 2015. The current usage metrics is available 48-96 hours after online publication and is updated daily on week days.
Initial download of the metrics may take a while.