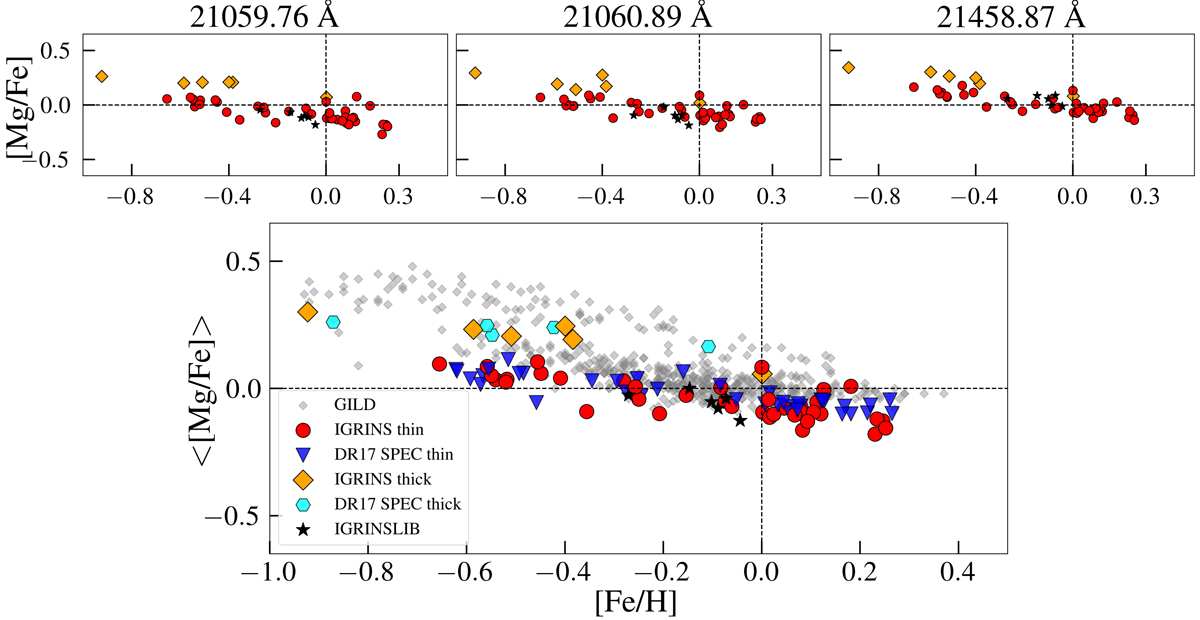
Fig. 9.
Download original image
[Mg/Fe] vs. [Fe/H] trends estimated from each magnesium line (top row panels) and the trend from the mean of line-by-line [Mg/Fe] estimates (bottom panel). The red circles, orange diamonds, and black stars in all panels represent the 38 thin-disk solar neighborhood M giants, six thick-disk solar neighborhood M giants and the six nearby M giants, respectively. The gray diamonds in the bottom panel represent the stars in the GILD sample, with the parameters and abundances estimated from optical FIES spectra and shifted down by 0.1 dex. The inverted blue triangles (thin-disk) and cyan hexagons (thick-disk) represent the APOGEE spectroscopic estimates for the 43 solar neighborhood stars.
Current usage metrics show cumulative count of Article Views (full-text article views including HTML views, PDF and ePub downloads, according to the available data) and Abstracts Views on Vision4Press platform.
Data correspond to usage on the plateform after 2015. The current usage metrics is available 48-96 hours after online publication and is updated daily on week days.
Initial download of the metrics may take a while.