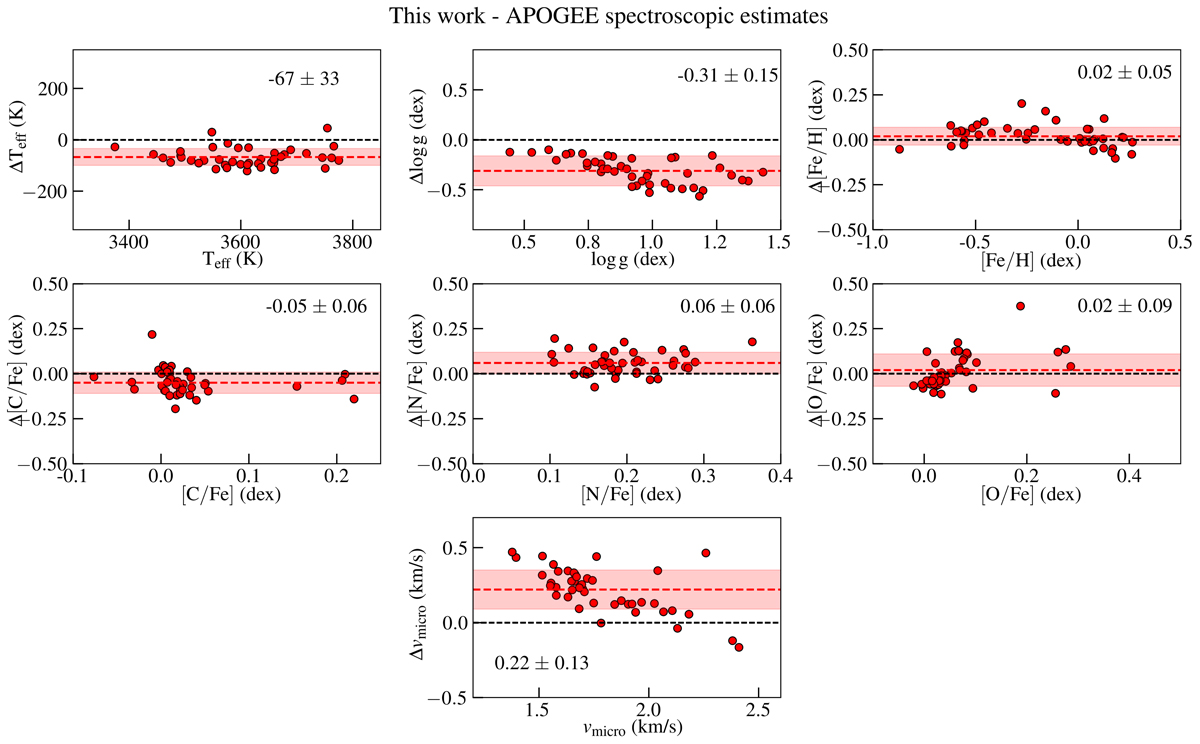
Fig. 4.
Download original image
Differences (this work - APOGEE spectroscopic estimates) in Teff, log g, [Fe/H], ξmicro, [C/Fe], [N/Fe], and [O/Fe] on the y-axis vs. the APOGEE spectroscopic estimates on the x-axis for the 44 stars in the solar neighborhood from our new IGRINS observations. Teff, log g, and [Fe/H] are shown in the three panels in the top row, [C/Fe], [N/Fe], and [O/Fe] in the three panels in the middle row, and ξmicro is plotted in the bottom row panel. The dashed black line indicates the difference value of 0.0 between APOGEE and our estimates. The mean difference and standard deviation (calculated as the middle value of the 84th–16th percentile values for each parameter) is indicated by the dashed red line and the red band, respectively, and is also listed in the respective panels.
Current usage metrics show cumulative count of Article Views (full-text article views including HTML views, PDF and ePub downloads, according to the available data) and Abstracts Views on Vision4Press platform.
Data correspond to usage on the plateform after 2015. The current usage metrics is available 48-96 hours after online publication and is updated daily on week days.
Initial download of the metrics may take a while.