Fig. 3.
Download original image
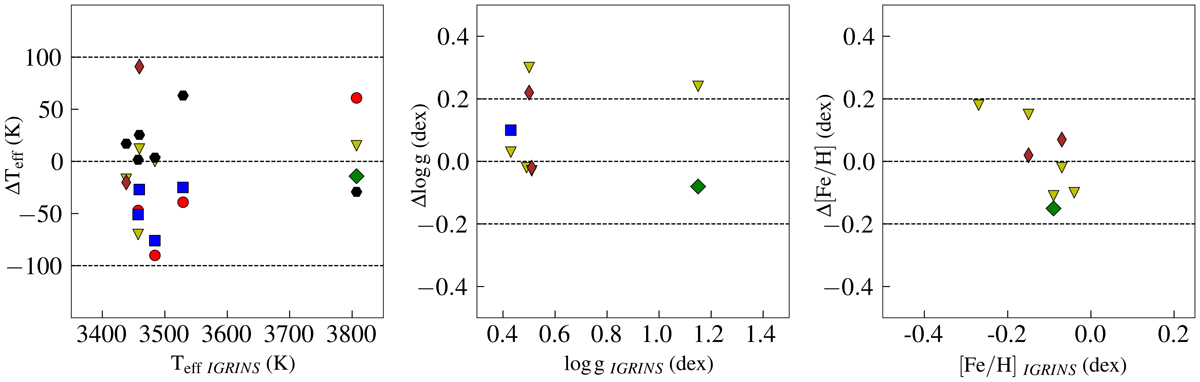
Difference (literature – this work) in Teff (left panel), log g (middle panel), and [Fe/H] (right panel) on the y-axis vs. the respective parameter estimates using our method (x-axis) for the six nearby M giant stars in the IGRINS spectral library. Differently colored symbols represent the compiled literature estimates: red circles show Baines et al. (2021), blue squares show Lebzelter et al. (2019), green diamonds show Jönsson et al. (2014), inverted yellow triangles show Sharma et al. (2016), and brown diamonds show Guerço et al. (2019). The black circles denote the Teff estimated using the Teff vs. (V-K)0 relation in Eq. (2) (from Bessell et al. 1998). K2MASS has been corrected to the photometric system in Bessell & Brett (1988; https://irsa.ipac.caltech.edu/data/2MASS/docs/releases/allsky/doc/sec6_4b.html)
Current usage metrics show cumulative count of Article Views (full-text article views including HTML views, PDF and ePub downloads, according to the available data) and Abstracts Views on Vision4Press platform.
Data correspond to usage on the plateform after 2015. The current usage metrics is available 48-96 hours after online publication and is updated daily on week days.
Initial download of the metrics may take a while.