Fig. 7
Download original image
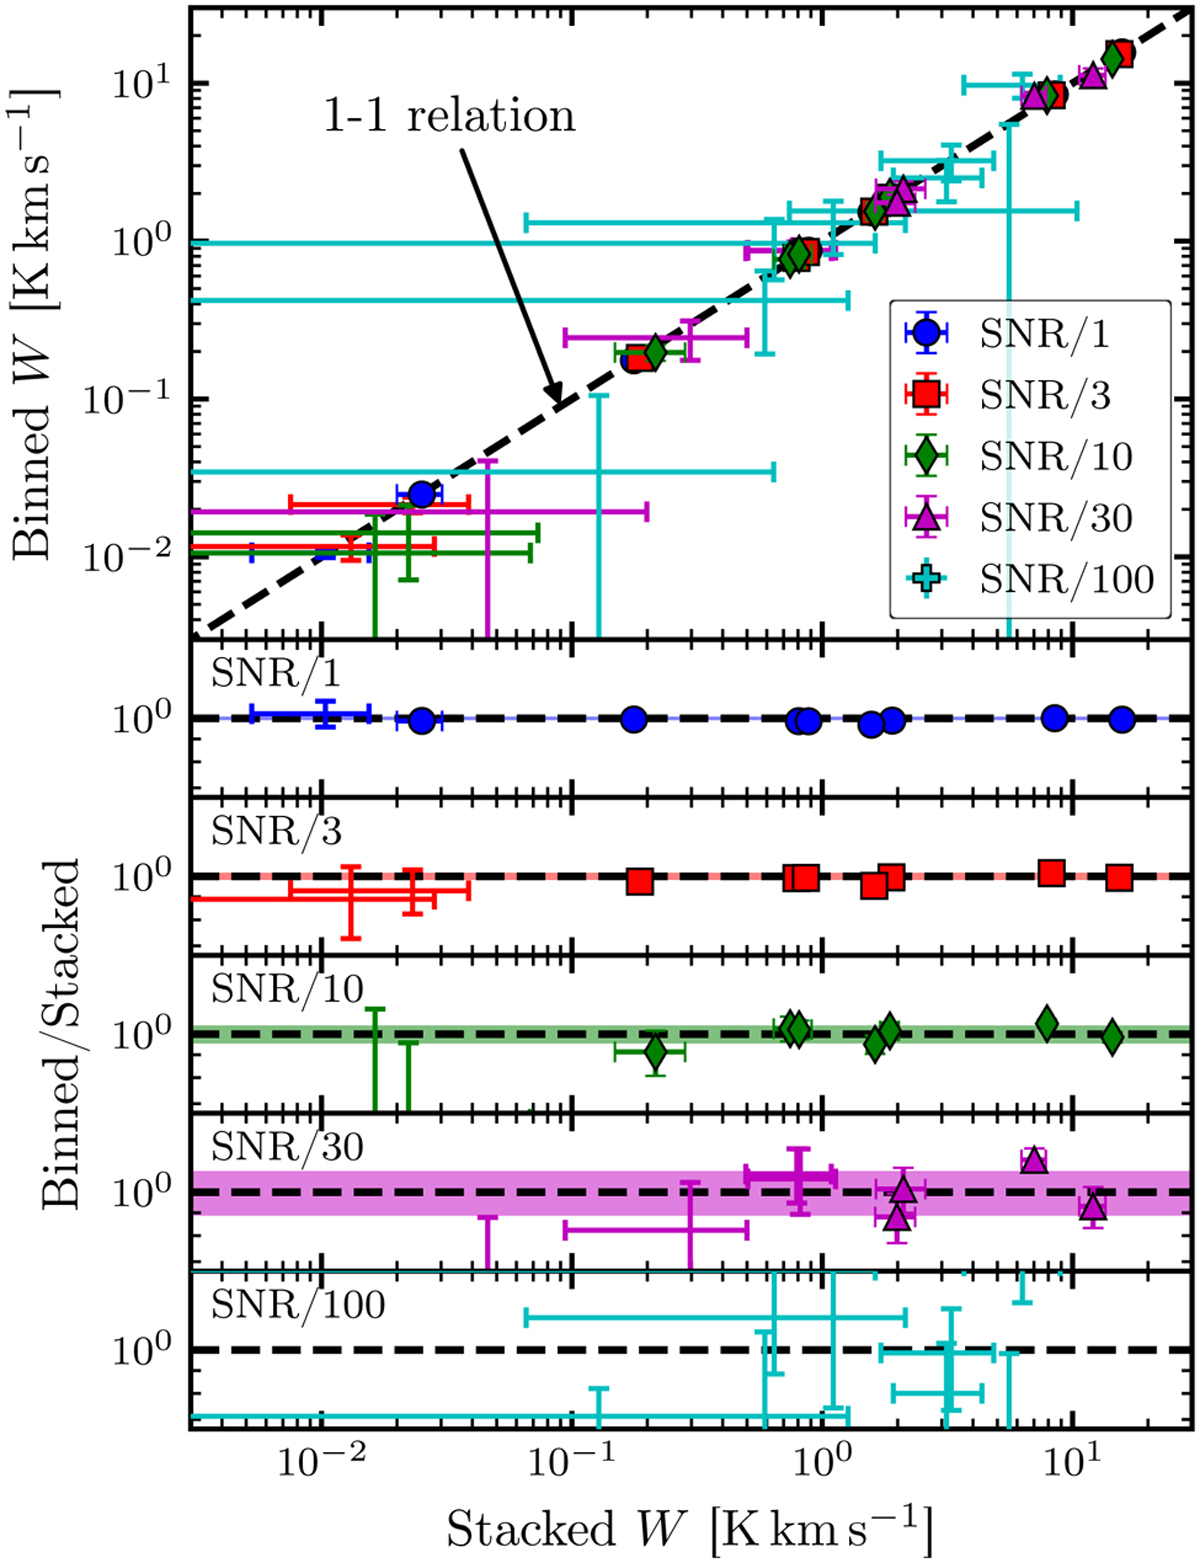
Binning vs stacking. Top: Binned means vs stacked integrated intensities in matched radial bins. The dashed line marks the 1-to-l relation. Different markers indicate the values recovered from the different S/N cubes. Data above 3σW are shown as markers, else only the error bars are plotted. Bottom panels: Ratio of binned mean and stacks to the stacked integrated intensities, separately for each S/N/X cube (X = 1, 3, 10, 30). The shaded areas indicate the respective 1σ scatter of the 3σW data.
Current usage metrics show cumulative count of Article Views (full-text article views including HTML views, PDF and ePub downloads, according to the available data) and Abstracts Views on Vision4Press platform.
Data correspond to usage on the plateform after 2015. The current usage metrics is available 48-96 hours after online publication and is updated daily on week days.
Initial download of the metrics may take a while.