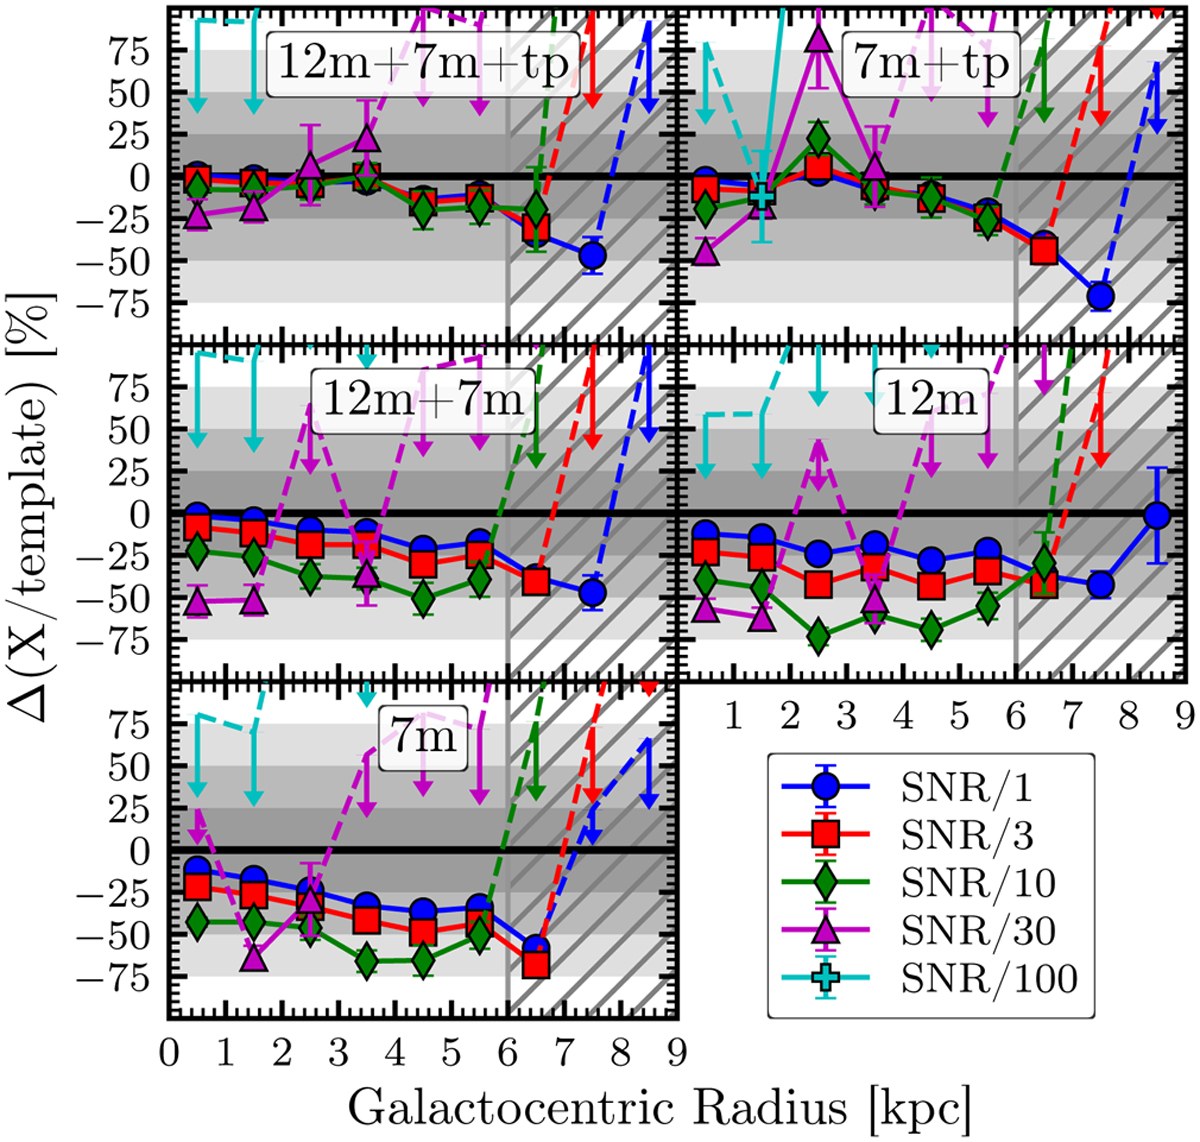
Fig. 5
Download original image
Flux recovery using different array configurations. Comparison between radial stacking obtained from different array configurations (X = {12m + 7m + tp, 7m + tp, 12m + 7m, 12m, 7m}), as indicated in the top of each panel. Shown is the ratio between the radial stacks obtained from the simulated data cubes at the given combination of telescope arrays and the true template values against the galactocentric radius. Solid points show data above 3σ and downward pointing arrows denote 3σ upper limits. The hatched area denotes the regime, where the prior, i.e. S/N/1, is detected in less than 20% of the pixels.
Current usage metrics show cumulative count of Article Views (full-text article views including HTML views, PDF and ePub downloads, according to the available data) and Abstracts Views on Vision4Press platform.
Data correspond to usage on the plateform after 2015. The current usage metrics is available 48-96 hours after online publication and is updated daily on week days.
Initial download of the metrics may take a while.