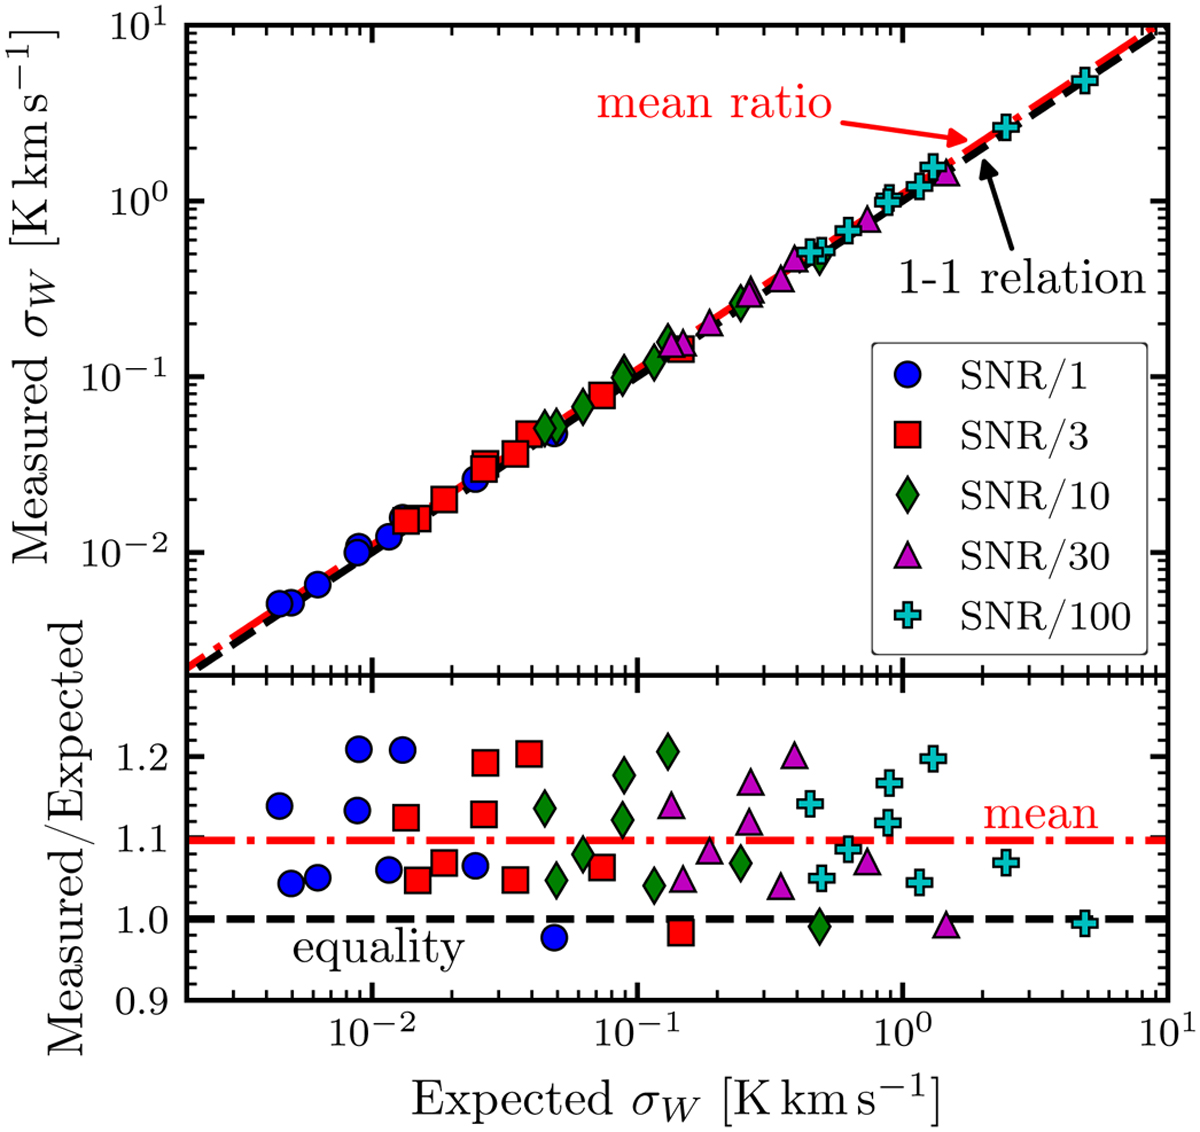
Fig. 4
Download original image
Measured vs expected uncertainties. Top: Comparison between measured (12m+7m+tp) and expected uncertainties of the integrated stacks. The measured uncertainty is obtained from the emission free channel of the stacked spectra following Eq. (3). The expected uncertainty is inferred via Gaussian error propagation from the S/N/100 cube treated as a noise cube. Bottom: Ratio of the measured to the expected uncertainties.
Current usage metrics show cumulative count of Article Views (full-text article views including HTML views, PDF and ePub downloads, according to the available data) and Abstracts Views on Vision4Press platform.
Data correspond to usage on the plateform after 2015. The current usage metrics is available 48-96 hours after online publication and is updated daily on week days.
Initial download of the metrics may take a while.