Fig. 3
Download original image
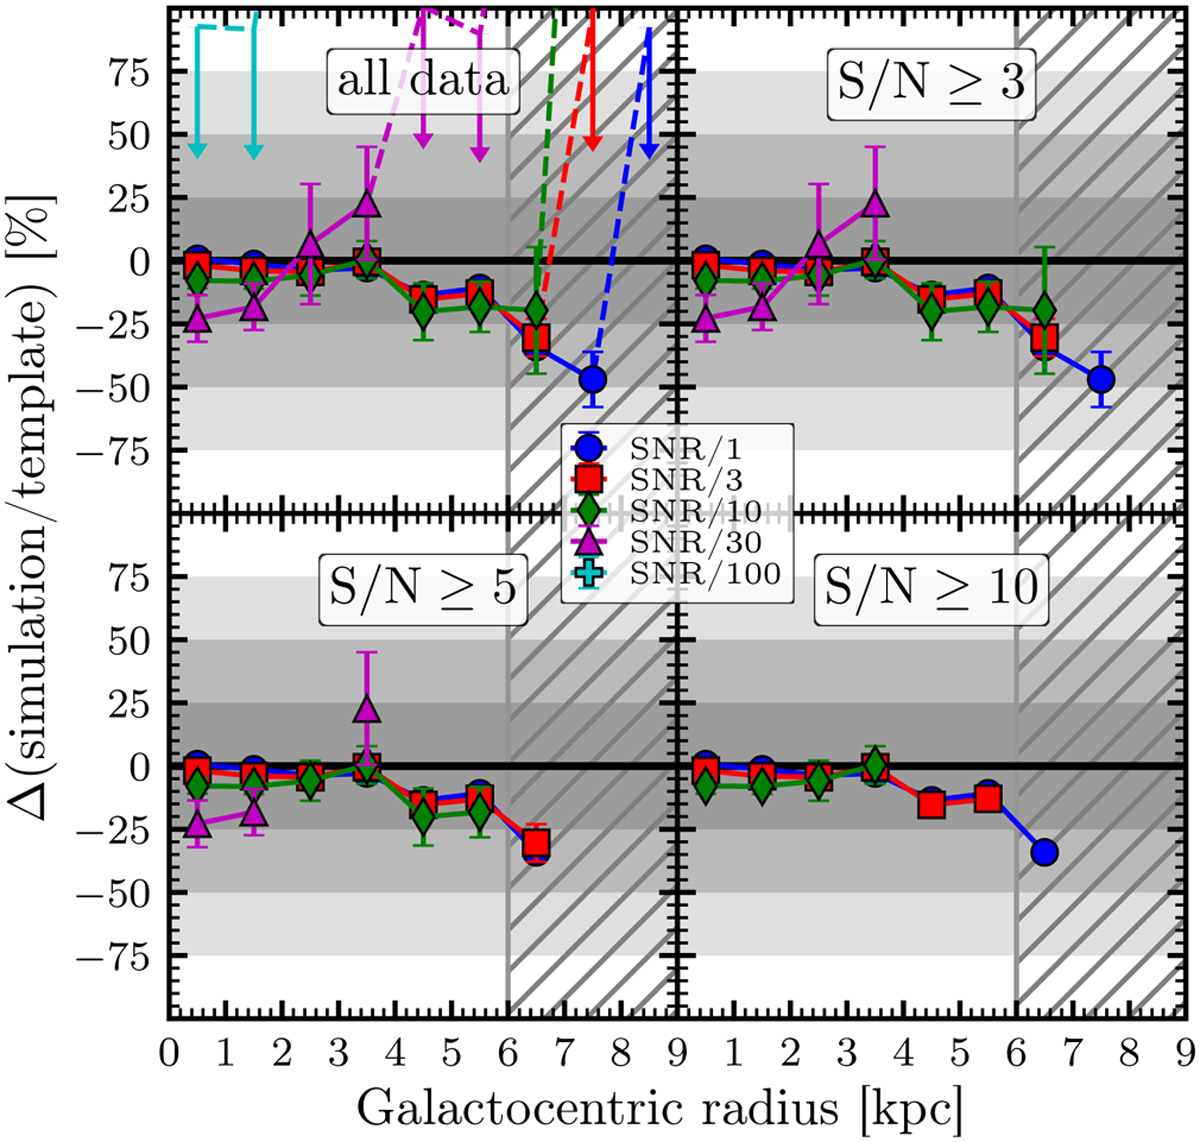
Agreement between measured and expected radial trends at different sigma-clipping levels. Shown is the relative differences between the measured radial stacks from the simulated 12m+7m+tp cubes and the true stacks, as follows from the bottom left panel of Fig. 2, by subtracting the template trend. The difference between the different panels is that the data of the resulting stacks is clipped at 3, 5, or 10 S/N (WσW). The stacking procedure is always the same. The hatched area denotes the regime, where the prior S/N/1 is detected in less than 20% of the pixels.
Current usage metrics show cumulative count of Article Views (full-text article views including HTML views, PDF and ePub downloads, according to the available data) and Abstracts Views on Vision4Press platform.
Data correspond to usage on the plateform after 2015. The current usage metrics is available 48-96 hours after online publication and is updated daily on week days.
Initial download of the metrics may take a while.