Fig. 2
Download original image
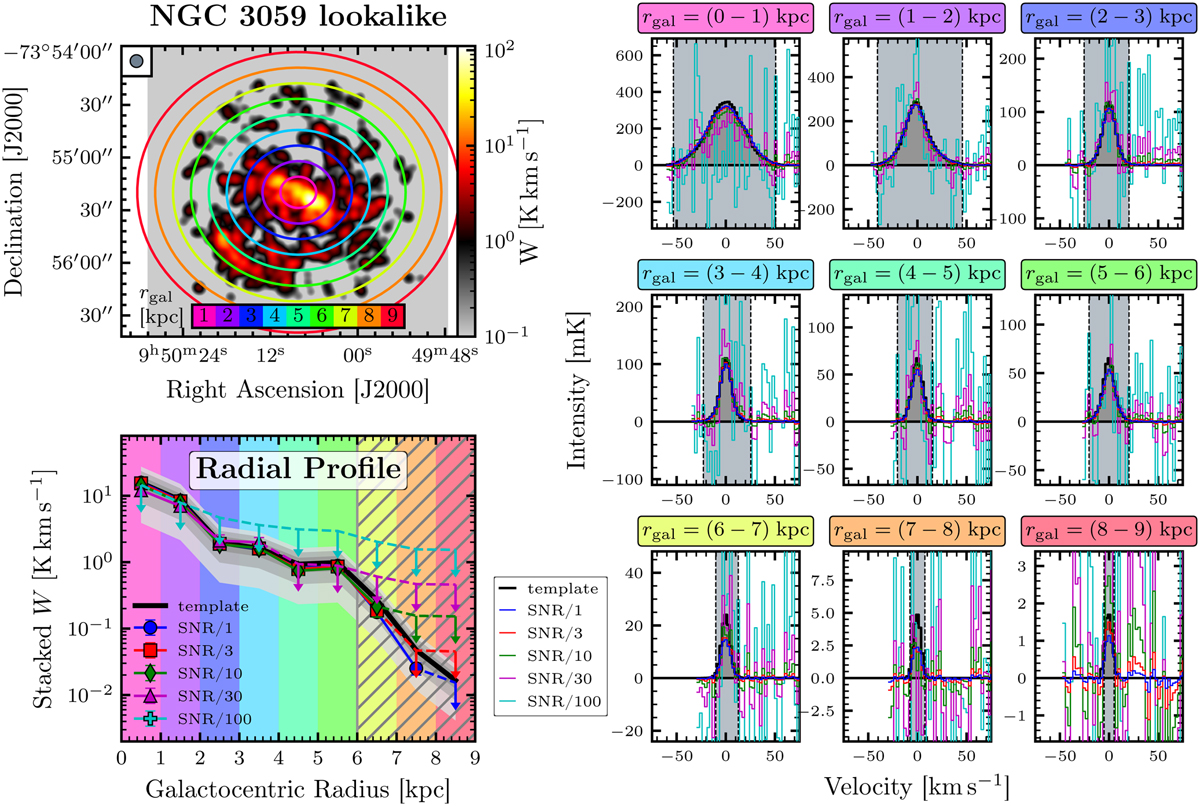
Spectral stacking of the NGC 3059 template galaxy via galactocentric radius. Top left: moment-0 map of the true (i.e. known) simulated CO(2−1) emission mimicking the intensity distribution of NGC 3059. The data have been convolved to the common highest resolution over all array configurations (7.2″) indicated by the grey circle in the upper left. The coloured rings show the loci of the galactocentric radius. Right panels: stacked spectra in 1 kpc radial bins from the centre out to 9 kpc as illustrated in the top left panel. The dark grey histogram shows the true spectra (i.e. those obtained by stacking the input template). The coloured lines show the stacked spectra from the respective simulated data cubes. The grey-shaded area indicates the velocity range used to compute the integrated intensities. Bottom left: stacked integrated intensities corresponding to the spectra shown in the right panels plotted against galactocentric radius. The black line shows the true radial trend, and the coloured lines show the recovered trend of the simulated data cubes. Solid points indicate data above 3σ; downward pointing arrows denote 3σ upper limits. The grey shaded areas show differences to the true trend in levels of ±{25, 50, 75}%. The hatched area denotes the regime where the prior S/N/1 is detected (S/N ≥ 3) in less than 20% of the pixels.
Current usage metrics show cumulative count of Article Views (full-text article views including HTML views, PDF and ePub downloads, according to the available data) and Abstracts Views on Vision4Press platform.
Data correspond to usage on the plateform after 2015. The current usage metrics is available 48-96 hours after online publication and is updated daily on week days.
Initial download of the metrics may take a while.