Fig. 1
Download original image
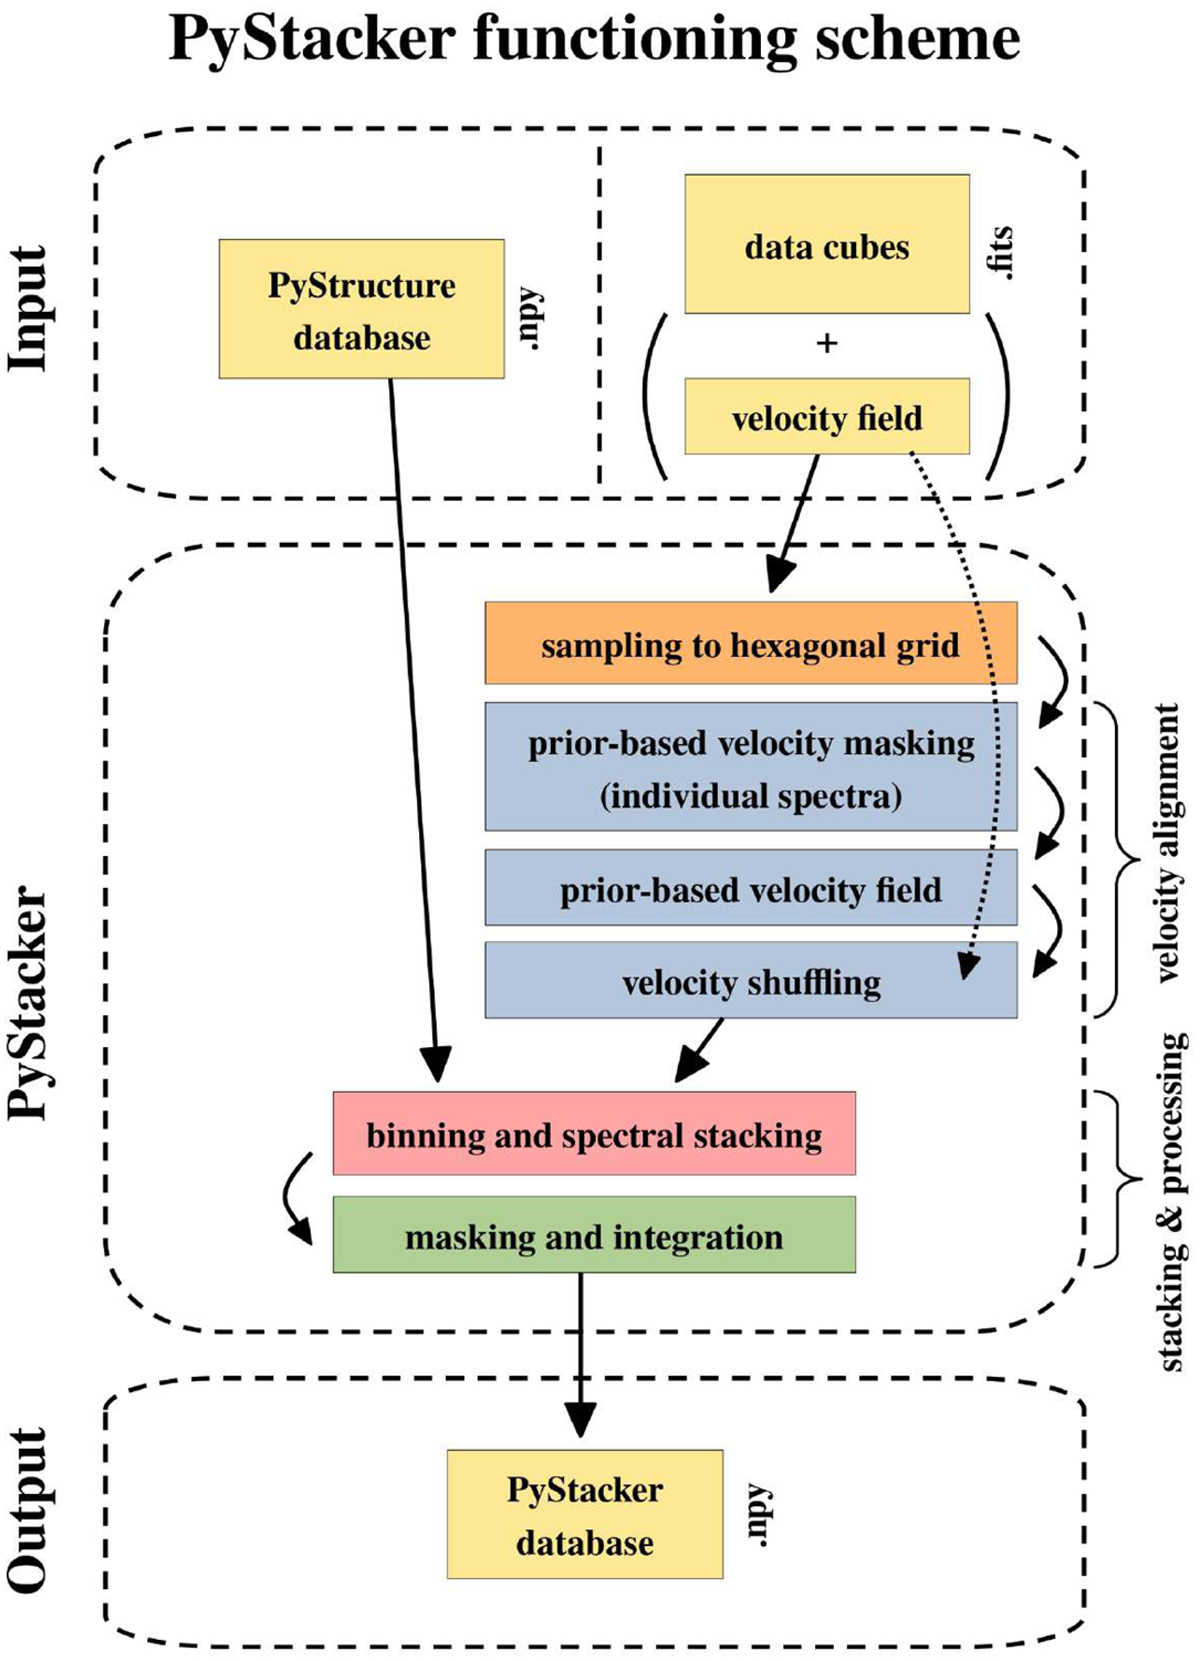
Schematic of the PyStacker package functioning principle. The input can be either a so-called PyStructure database (at the moment of submission only internally used) or FITS files of data cubes containing the molecular line emission. The latter is applicable to all users. The PyStructure files does already include the re-sampled and velocity aligned data. If FITS files are provided, the PyStacker package will perform the velocity alignment given an input prior or take the input velocity field. In both cases, the spectra will be stacked according to the input stacking quantity and processed to retrieve average integrated intensities. The results are then returned as a Python dictionary, which can be read e.g. following the example script coming with the PyStacker package.
Current usage metrics show cumulative count of Article Views (full-text article views including HTML views, PDF and ePub downloads, according to the available data) and Abstracts Views on Vision4Press platform.
Data correspond to usage on the plateform after 2015. The current usage metrics is available 48-96 hours after online publication and is updated daily on week days.
Initial download of the metrics may take a while.