Fig. 9
Download original image
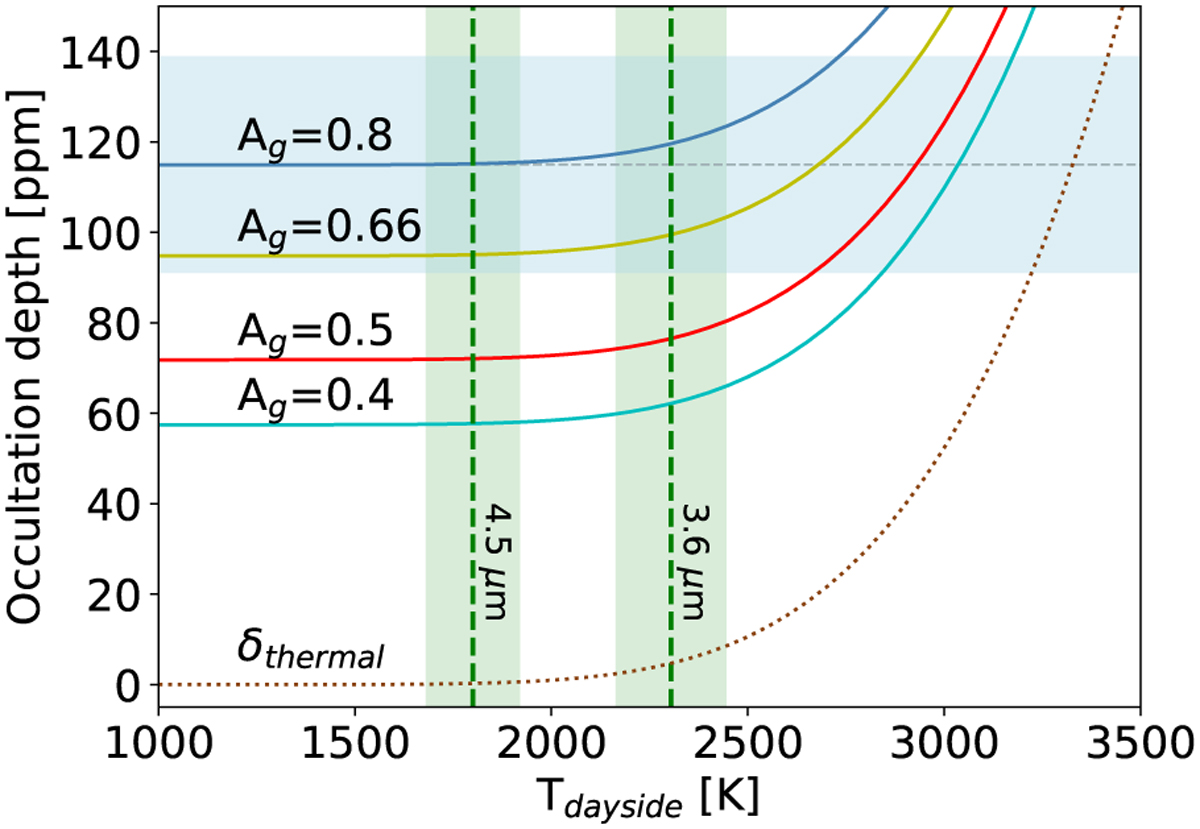
Contribution of the reflected and thermal components in the occultation depth of LTT 9779 b for the CHEOPS wavelengths. The blue region marks the occultation depth (±1 σ) measured with CHEOPS. The dotted curve represents the thermal component, and the solid curves represent the summed contribution of the two components, i.e., including the effect of the reflected light for different geometric albedos (Ag). The vertical green bands show the dayside temperature measured with Spitzer at 3.6 and 4.5 µm.
Current usage metrics show cumulative count of Article Views (full-text article views including HTML views, PDF and ePub downloads, according to the available data) and Abstracts Views on Vision4Press platform.
Data correspond to usage on the plateform after 2015. The current usage metrics is available 48-96 hours after online publication and is updated daily on week days.
Initial download of the metrics may take a while.