Fig. 7
Download original image
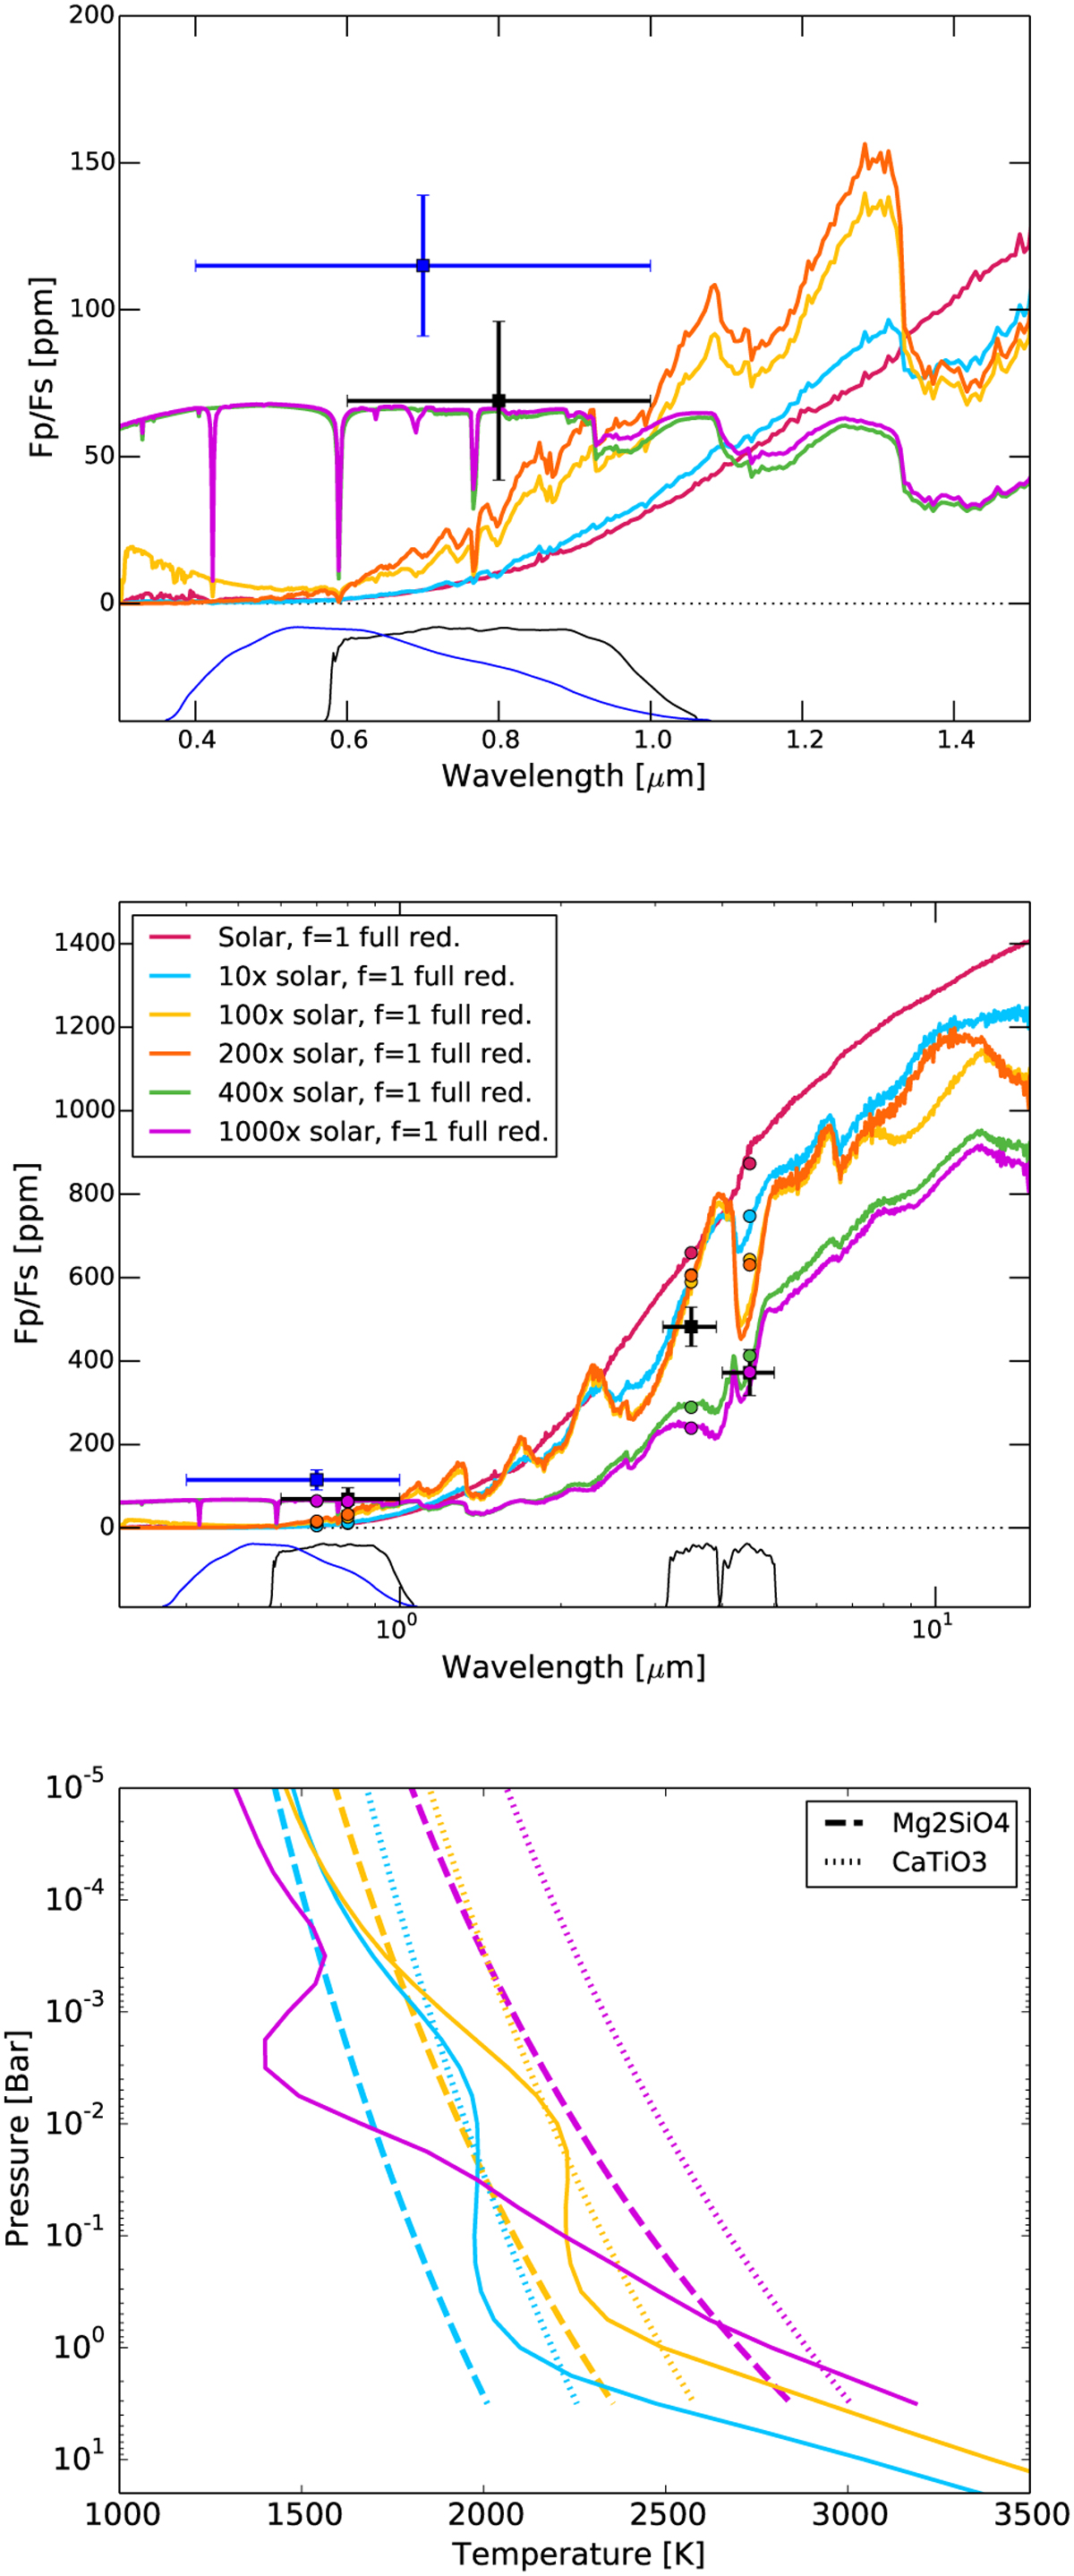
Modeled optical (top) and optical+NIR (middle) spectrum of LTT 9779 b compared to the CHEOPS (blue symbol), TESS, and Spitzer (black symbols) observations for models assuming a full redistribution of heat and different metallicities. The respective scaled transmission curve of each instrument is also shown at the bottom of the panel. In the bottom panel, we show the modeled thermal profiles for a subsample of models together with the condensation curves of Mg2SЮ4 and CaTiO3 for different metallicities (color). The condensation curves scale with metallicity. The geometric albedos in the CHEOPS bandpass and Bond albedos are lower than 0.01 for metallicities lower than 200 times solar and increase to 0.45 and 0.75, respectively, for metallicities 400 times solar and higher.
Current usage metrics show cumulative count of Article Views (full-text article views including HTML views, PDF and ePub downloads, according to the available data) and Abstracts Views on Vision4Press platform.
Data correspond to usage on the plateform after 2015. The current usage metrics is available 48-96 hours after online publication and is updated daily on week days.
Initial download of the metrics may take a while.