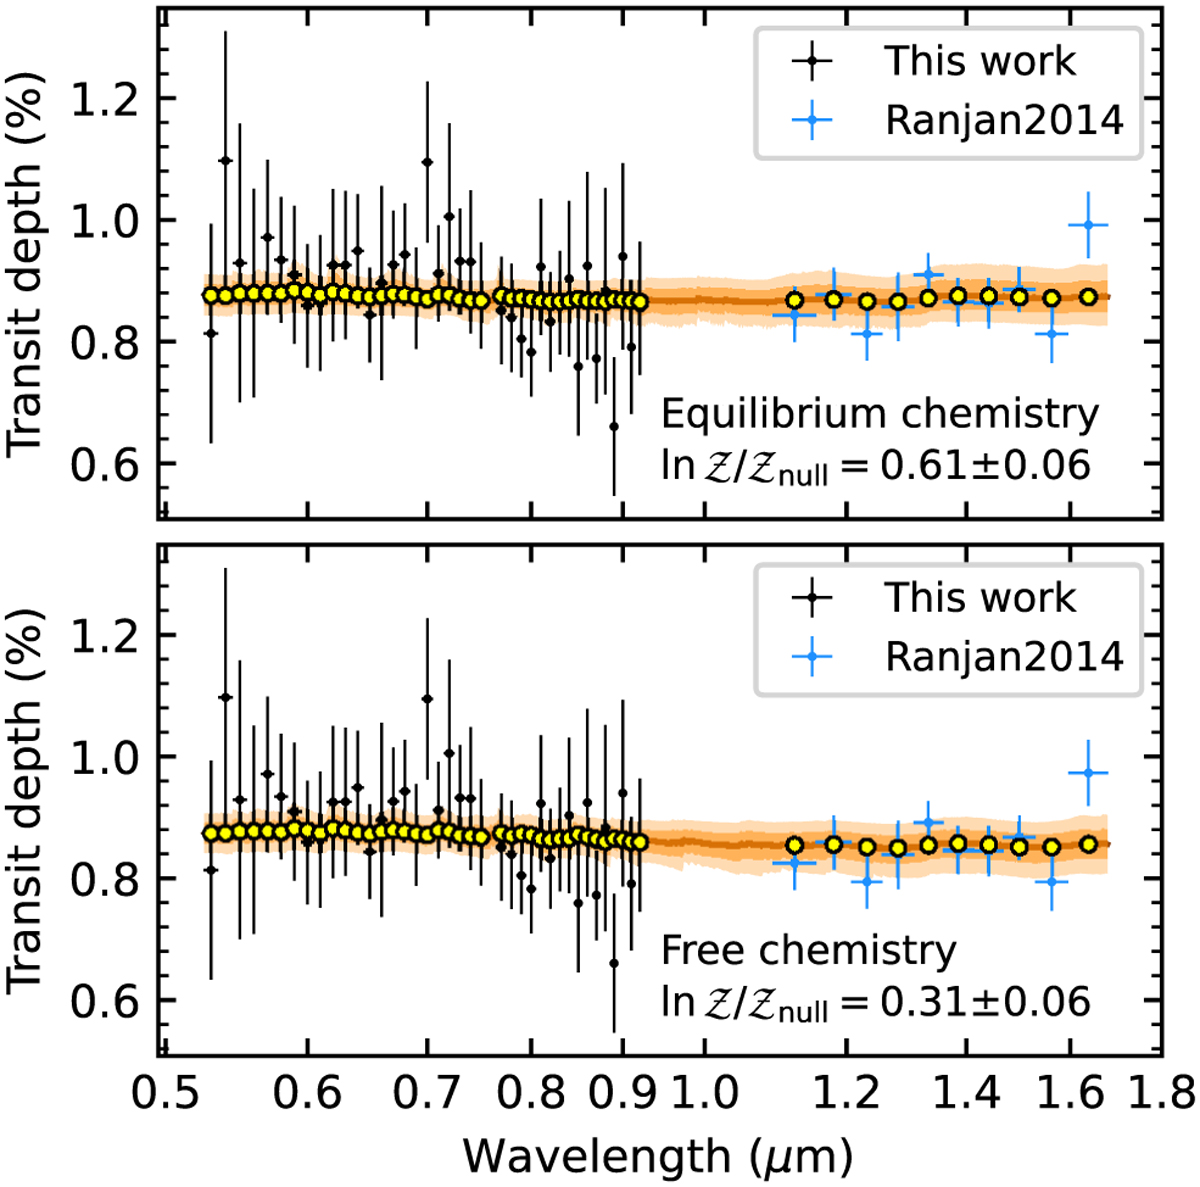
Fig. 7
Download original image
Retrieval results of the optical-to-NIR spectra of TrES-4b. The results from the equilibrium chemistry model and the free chemistry model are shown in the upper and the lower panels, respectively. The orange line and the shaded areas indicate the posteriors distribution of the retrieved spectra. The yellow dots correspond to the models rebinned to the data passbands. The median offsets of the NIR spectra are -246 ppm in the upper panel and -430 ppm in the lower panel.
Current usage metrics show cumulative count of Article Views (full-text article views including HTML views, PDF and ePub downloads, according to the available data) and Abstracts Views on Vision4Press platform.
Data correspond to usage on the plateform after 2015. The current usage metrics is available 48-96 hours after online publication and is updated daily on week days.
Initial download of the metrics may take a while.