Fig. 6
Download original image
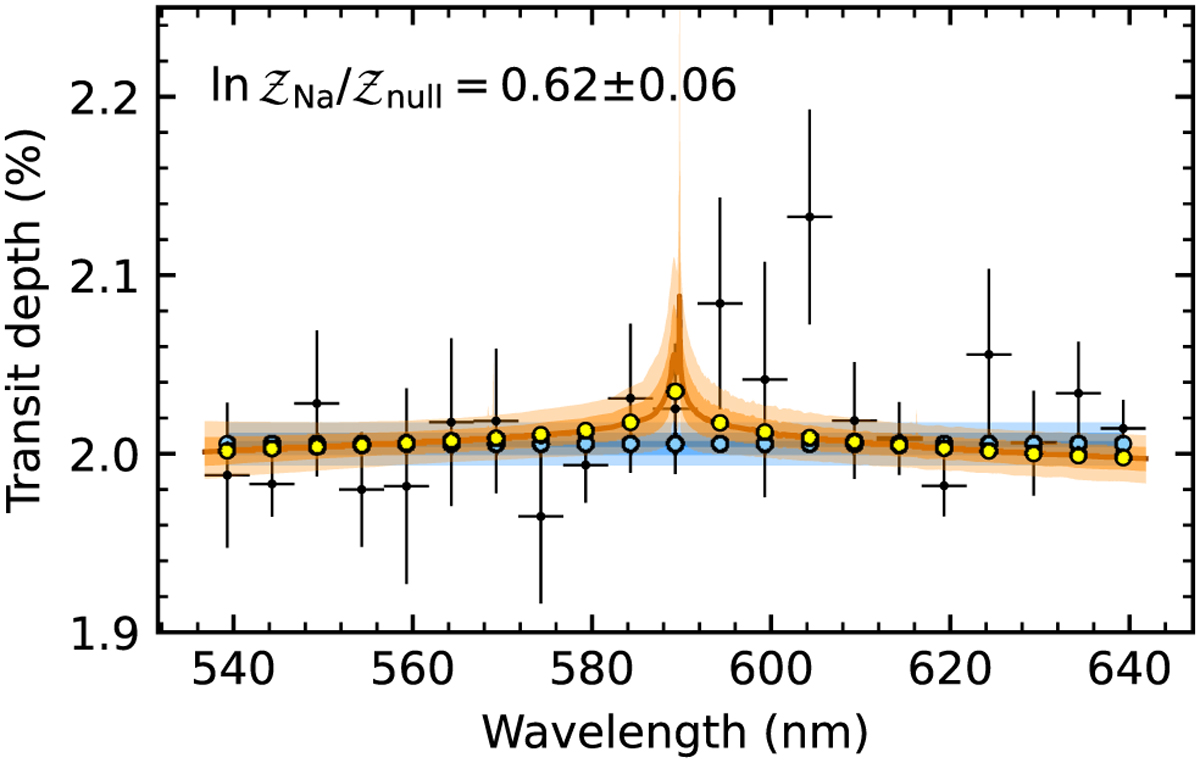
Transmission spectrum of CoRoT-1b zoomed into 536.8–641.8 nm and centered at the sodium D-lines. The black points with error bars are the observed data. The orange lines are the posteriors of free chemistry models with presence of atomic Na, while the blue lines are those of null models. The dots correspond to the models after a wavelength binning of 5 nm.
Current usage metrics show cumulative count of Article Views (full-text article views including HTML views, PDF and ePub downloads, according to the available data) and Abstracts Views on Vision4Press platform.
Data correspond to usage on the plateform after 2015. The current usage metrics is available 48-96 hours after online publication and is updated daily on week days.
Initial download of the metrics may take a while.