Fig. 5
Download original image
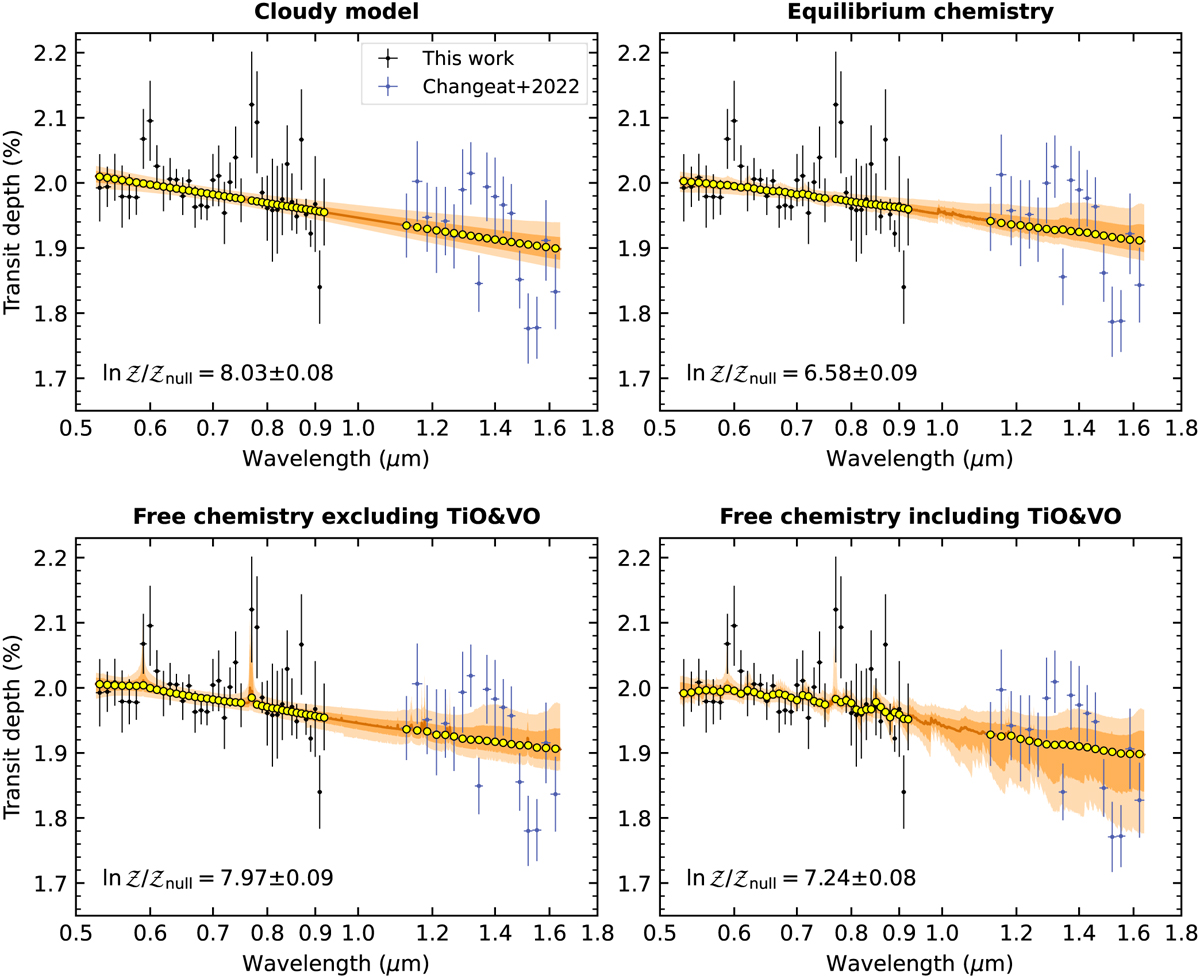
Retrieval results of the joint transmission spectra of CoRoT-1b using different model assumptions. The orange lines are the posteriors of the retrieved models. The yellow dots are models downsampled to the data passbands. The Bayesian evidence for each hypothesis is denoted as ln 𝒵. The median offsets of the NIR spectra in the retrievals have been added to the error bars in each panel, which are -92 ppm (upper left), 10 ppm (upper right), −54 ppm (lower left), and −146 ppm (lower right).
Current usage metrics show cumulative count of Article Views (full-text article views including HTML views, PDF and ePub downloads, according to the available data) and Abstracts Views on Vision4Press platform.
Data correspond to usage on the plateform after 2015. The current usage metrics is available 48-96 hours after online publication and is updated daily on week days.
Initial download of the metrics may take a while.