Fig. B.1
Download original image
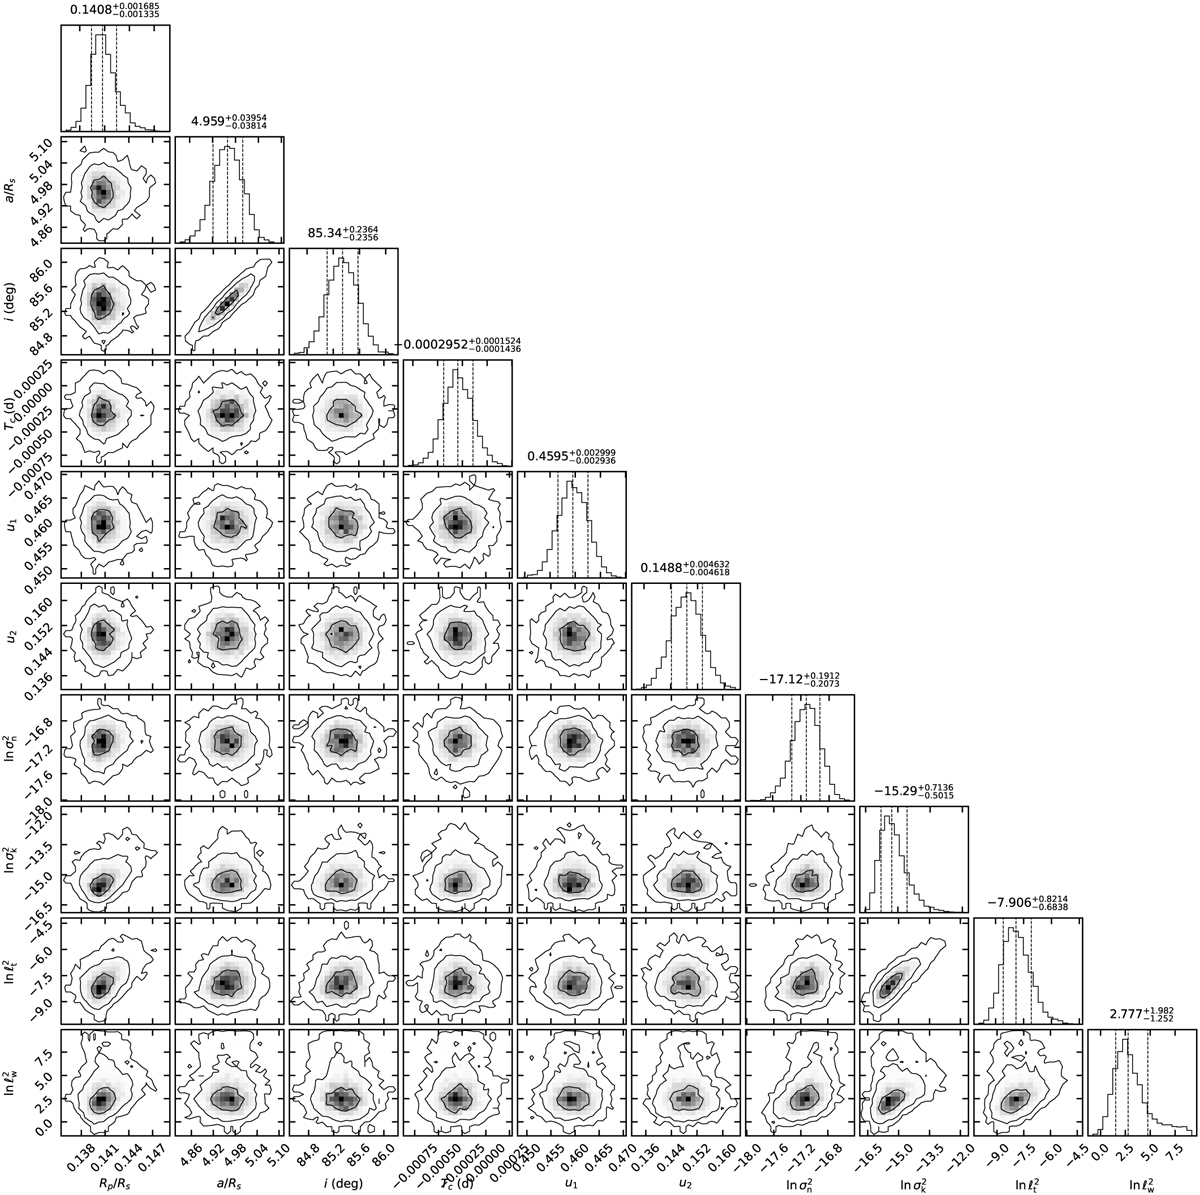
Posterior distribution of the parameters from the white-light-curve fitting of CoRoT-1b. The contours indicate 1- to 3-σ credible intervals. The parameters from left to right are Rp/Rs: planet-to-star radius ratio; α/Rs: orbital semimajor axis relative to star radius; i: orbital inclination, Tc: observed central transit time subtracting the predicted central transit time (BJDTDB); u1 and u2: quadratic limb-darkening coefficients; ![]() : variance of the GP jitter term;
: variance of the GP jitter term; ![]() : variance of the GP kernel function; ℓt and ℓw: length scales of the input variables (the time vector and the FWHM of the PSF).
: variance of the GP kernel function; ℓt and ℓw: length scales of the input variables (the time vector and the FWHM of the PSF).
Current usage metrics show cumulative count of Article Views (full-text article views including HTML views, PDF and ePub downloads, according to the available data) and Abstracts Views on Vision4Press platform.
Data correspond to usage on the plateform after 2015. The current usage metrics is available 48-96 hours after online publication and is updated daily on week days.
Initial download of the metrics may take a while.